We want Simple History to be fast.
Simple History is an activity log (audit log) plugin for WordPress — it records what users and plugins do on a site. It runs on over 300,000 websites, and a logging plugin that slows down 300,000 websites would be a pretty bad logging plugin. So we treat performance as a feature.
Sometimes as a developer you write easy and fast code – that later turns out to be bad and slow.
And sometimes you write slow and hard code – that turns out to be pretty fast after all.
The most useful thing performance work has taught us is to distrust our own guesses. A function that looks trivial can quietly eat CPU on every page load, while one that looks hairy and expensive turns out to be cheap. You genuinely cannot tell which is which by reading the code.
The best way to actually tell if something you have done is fast or slow is to measure it and to verify that it does not cause any unwanted side effects.
While developing this very audit log plugin we check for some specific things like:
- Speed: we check that it does not run a half-slow function 10,000 times. And we check that a single function is not slow.
- SQL Queries: we check that it does not perform unneeded SQL queries anywhere. For example the Admin Bar Quick View on the frontend does not perform any SQL queries or requests until you move your mouse over it.
- Feeling: this is a bit special as we can not measure it the same way as the other stuff, but we use the plugin ourselves every single day and we verify that everything we build actually feels nice to use. We verify that it feels fast and if something can’t be fast we make sure the user gets good feedback while the system is working.
How we measure things
We use PHP profiling and debug tools to check for issues in the code. The tools we have found useful are:
Query Monitor is the best tool for everyday debugging and performance checks
A lot of WordPress slowness is just queries — too many of them, or ones that didn’t need to run at all. So one of the habits is simply watching the query count. Query Monitor sits in the admin bar and tells you, for the page you just loaded, how many database queries ran, how long they took, and how much memory was used.
Query Monitor is the tool we use most and it’s always installed and activated in our local dev servers. It’s extremely useful to quickly see information about the current page.
Here is a screenshot of Query Monitor running on one of my local test sites. You can see the Query Monitor admin toolbar menu on the top right showing an overview of the current page. There you get a quick glance of Page Generation Time, memory usage, SQL query time and number of SQL queries. Super useful!
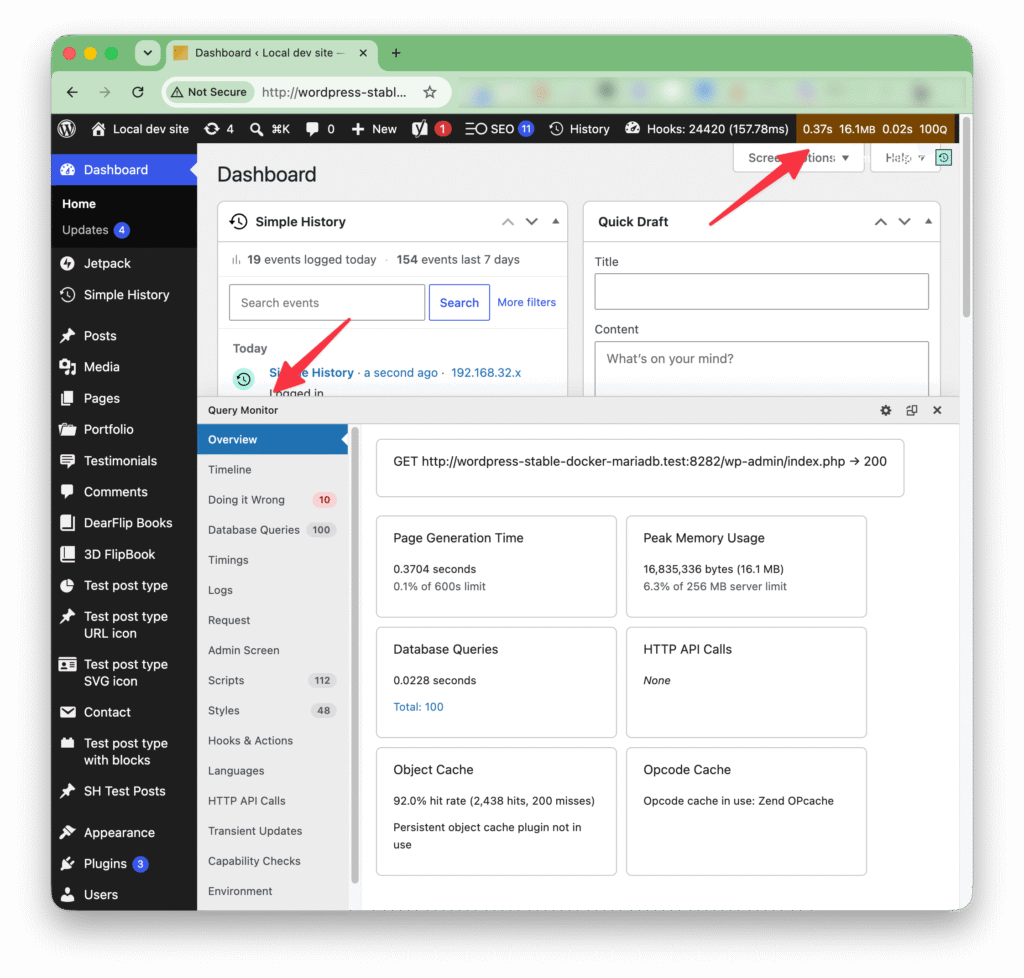
Then you can dig even deeper by opening the Query Monitor interface.
There are many panels available in the plugin. One very useful panel for quickly checking that Simple History is not running any queries on the frontend is Queries by Component. In the screenshot below we can see that on the front page of a website our plugin is not running any queries at all. Phew! 😅
On a normal frontend page load, Simple History runs zero SQL queries. Logging happens when something changes on the site, not when visitors read it.

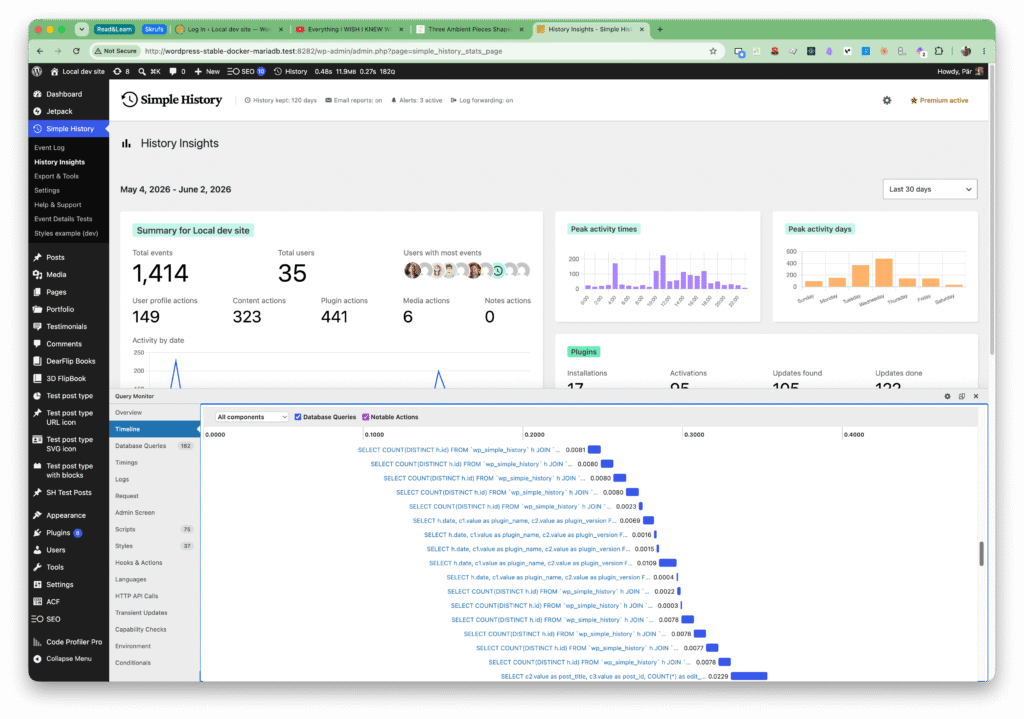
While we do not want the plugin to be doing anything noticeable on the frontend, it may be a different situation on the backend. Here we have the History Insights page showing a lot of detail about what’s going on on the website the last 30 days. Here we can expect that the plugin is doing heavy work and running many queries. The timeline view in Query Monitor confirms this: many queries and we can quickly spot any queries running slower than the others and start to investigate what’s going on.
So this was a quick overview of the Query Monitor plugin. It’s really a life saver and very useful to always have running locally. You will notice errors and performance issues easily and quickly.
(We like the Query Monitor plugin so much that we made a small donation in the past).
We profile on purpose, not just when something feels slow
When we want to see exactly where a request spends its time, a few tools help us find the culprit:
- SPX — produces a flame graph of a request right in the browser. The wide bars are where your time goes; once you’ve seen the bottleneck as a fat horizontal block, you can’t unsee it.
- Xdebug — its profiler output (read in something like QCacheGrind) gives call counts and per-function timings down to a fine grain, for when you need to understand why a function is slow rather than just that it is.
How we turn profiling on locally
To test features and check bugs in Simple History we use wp-env, the official WordPress Docker environment, and both SPX and Xdebug are already baked in.
This makes it easy to turn on profiling — it’s just a flag, not a whole separate setup.
SPX
For a quick flame graph, start with SPX:
wp-env start --spxThen open its in-browser UI at http://localhost:8888/?SPX_KEY=dev&SPX_UI_URI=/ and enable SPX. Then visit any page on http://localhost:8888/ and then reload the SPX UI and you will get a listing of all URLs loaded. Click on a URL and you will get a very fancy flame graph that visually shows the hierarchy of function calls.
They are not very easy to interpret as a beginner. Actually not for an experienced developer either – but I’m getting better at it. When I started using SPX and flame graphs I looked too much at the “spikes” and was worried about them. But in flame graphs spikes are not relevant, it is the plateaus that are relevant.
Here is an example:
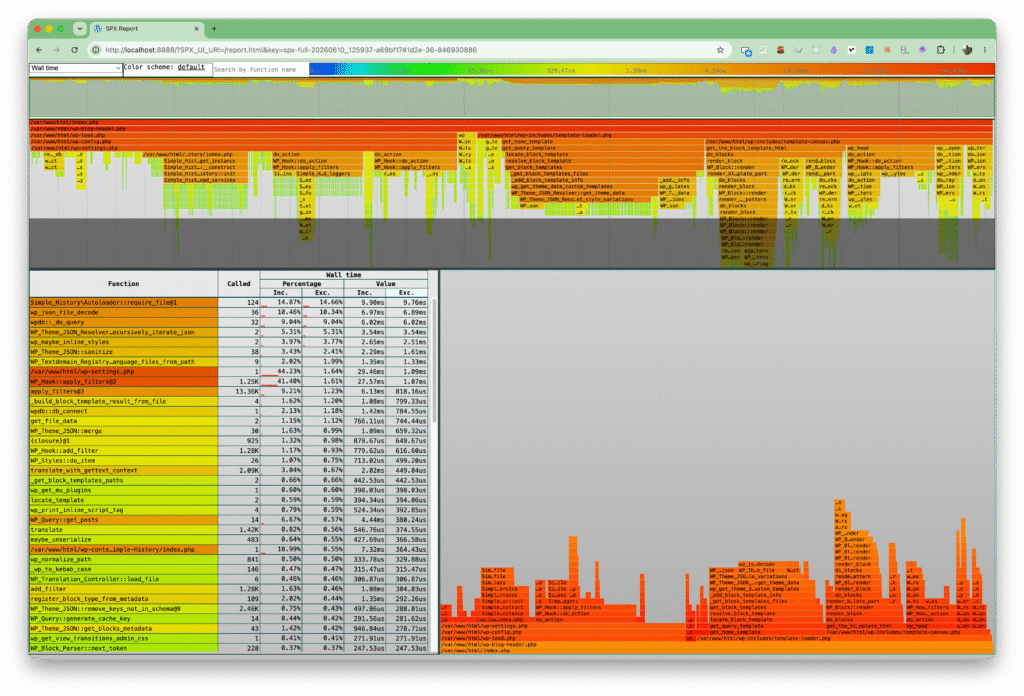
Not very easy to read – but when you are debugging or researching something, it can be very helpful when you know what you’re looking for.
Xdebug
Xdebug is a very useful tool that used to be a pain to get started with, but thanks to wp-env now it’s a breeze!
Just as with SPX, Xdebug profiles your code, but it goes deeper, with call counts and per-function timings. It does not come with a built-in visualization tool like SPX does — instead it writes “cachegrind” files that you open in a separate viewer.
Start wp-env in profile mode (this is profiling, not step debugging — that’s a different mode of the same flag):
wp-env start --xdebug=profileNow every request writes a cachegrind.out.<pid> file. The response headers tell you where it ended up:
X-Xdebug-Profile-Filename: /tmp/cachegrind.out.32Code language: JavaScript (javascript)And here is the gotcha that cost us a few minutes: that /tmp is inside the container, so you would have to fish every file out with docker cp. That gets old fast.
Getting the profiles out of the container
wp-env doesn’t let you set php.ini values directly, but it does let you map a custom .htaccess into the site root — and xdebug.output_dir happens to be settable from .htaccess. Since wp-env already mounts your plugin folder onto your machine, point the output dir at a subfolder of your plugin and the files just show up locally, no copying needed.
The setup is four small steps. Everything is local-only and gitignored, so the shared .wp-env.json that your team uses stays untouched.
1. Create a .wp-env.override.json in the project root that maps a custom .htaccess into the WordPress root:
{
  "mappings": {
    ".htaccess": "./.wp-env/htaccess"
  }
}Code language: JSON / JSON with Comments (json)
2. Create .wp-env/htaccess. Start with a copy of the standard WordPress rewrite rules — without them pretty permalinks will start 404ing — and then append the following line. Swap in your own plugin’s folder name:
php_value xdebug.output_dir "/var/www/html/wp-content/plugins/your-plugin/xdebug-profiles"Code language: JavaScript (javascript)3. Create the output folder:
mkdir -p xdebug-profiles4. Restart so the mapping applies:
wp-env start --xdebug=profile --updateThat’s it. From now on every cachegrind.out.* file lands directly in your plugin’s xdebug-profiles/ folder. The mapping re-applies on every --update, so restarting wp-env later is safe.
Viewing the results
On macOS we use QCacheGrind to open the profiles:
brew install qcachegrind
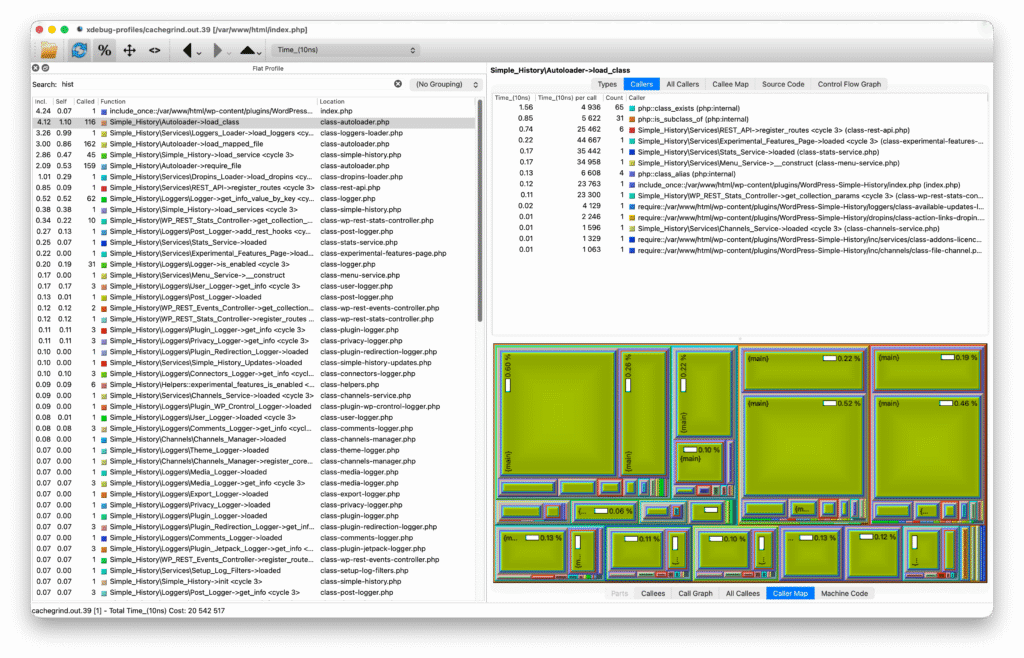
qcachegrind xdebug-profiles/cachegrind.out.<pid>Code language: HTML, XML (xml)That gives you output like the screenshot below. You can view useful info like how many times a function has been called, and how much time is spent in the function itself versus in the function plus the calls it makes.
Profiling is lots of work – but we think it’s worth it
An audit log plugin sits in the background of someone else’s site. It should be the last thing that ever makes the website feel slow. Keeping it fast is really just respect for the user’s time and their server — and the only way we know to keep that promise is to keep measuring, keep questioning the queries, and let the profiler tell us when we’re wrong.