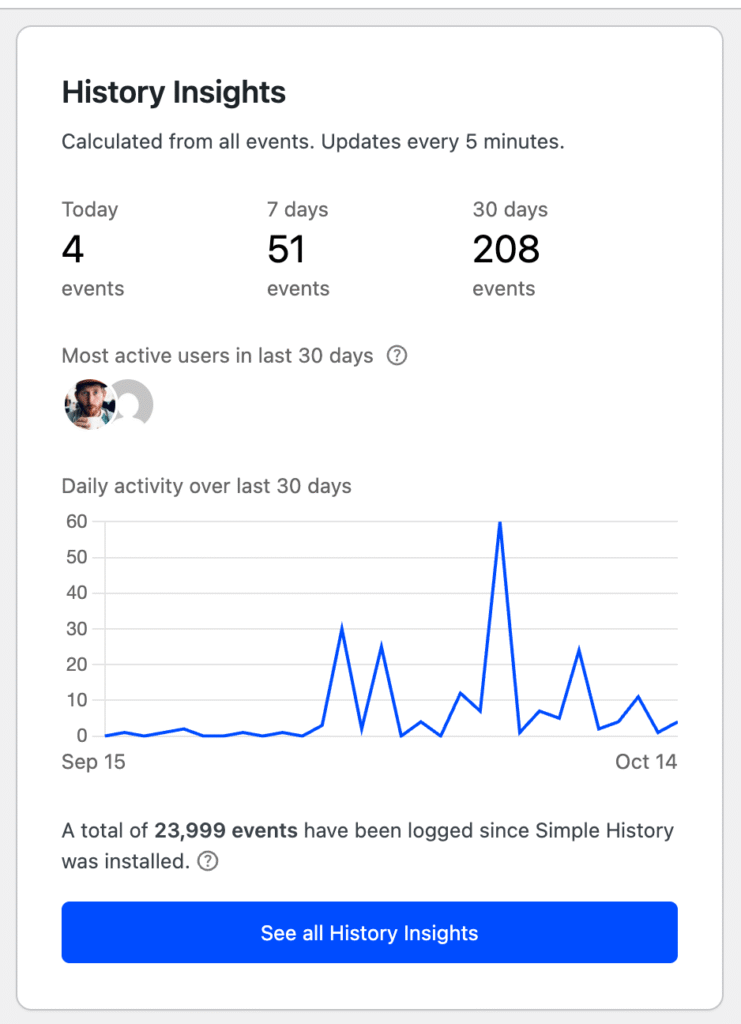
The “Stats & Insights” box keeps track of some information regarding the events that have been logged. It is shown next to the main log.
It gives you information about:
- The number of events from today, last 7 days, and last 30 days.
- The most active users the last 30 days.
- A graph of daily activity the last 30 days.
- The total number of logged events since the plugin was installed.
This information gives you a quick overview of how many events have been logged each day and you can quickly see if the number of events has a spike or a drop and you can quickly act to view suspicious days for activity.
