
The table view shows your event log as a table you can sort, filter and export. Use it when you are looking for something specific: who changed a setting last Tuesday, what happened right before the site broke, or every failed login from one IP address.
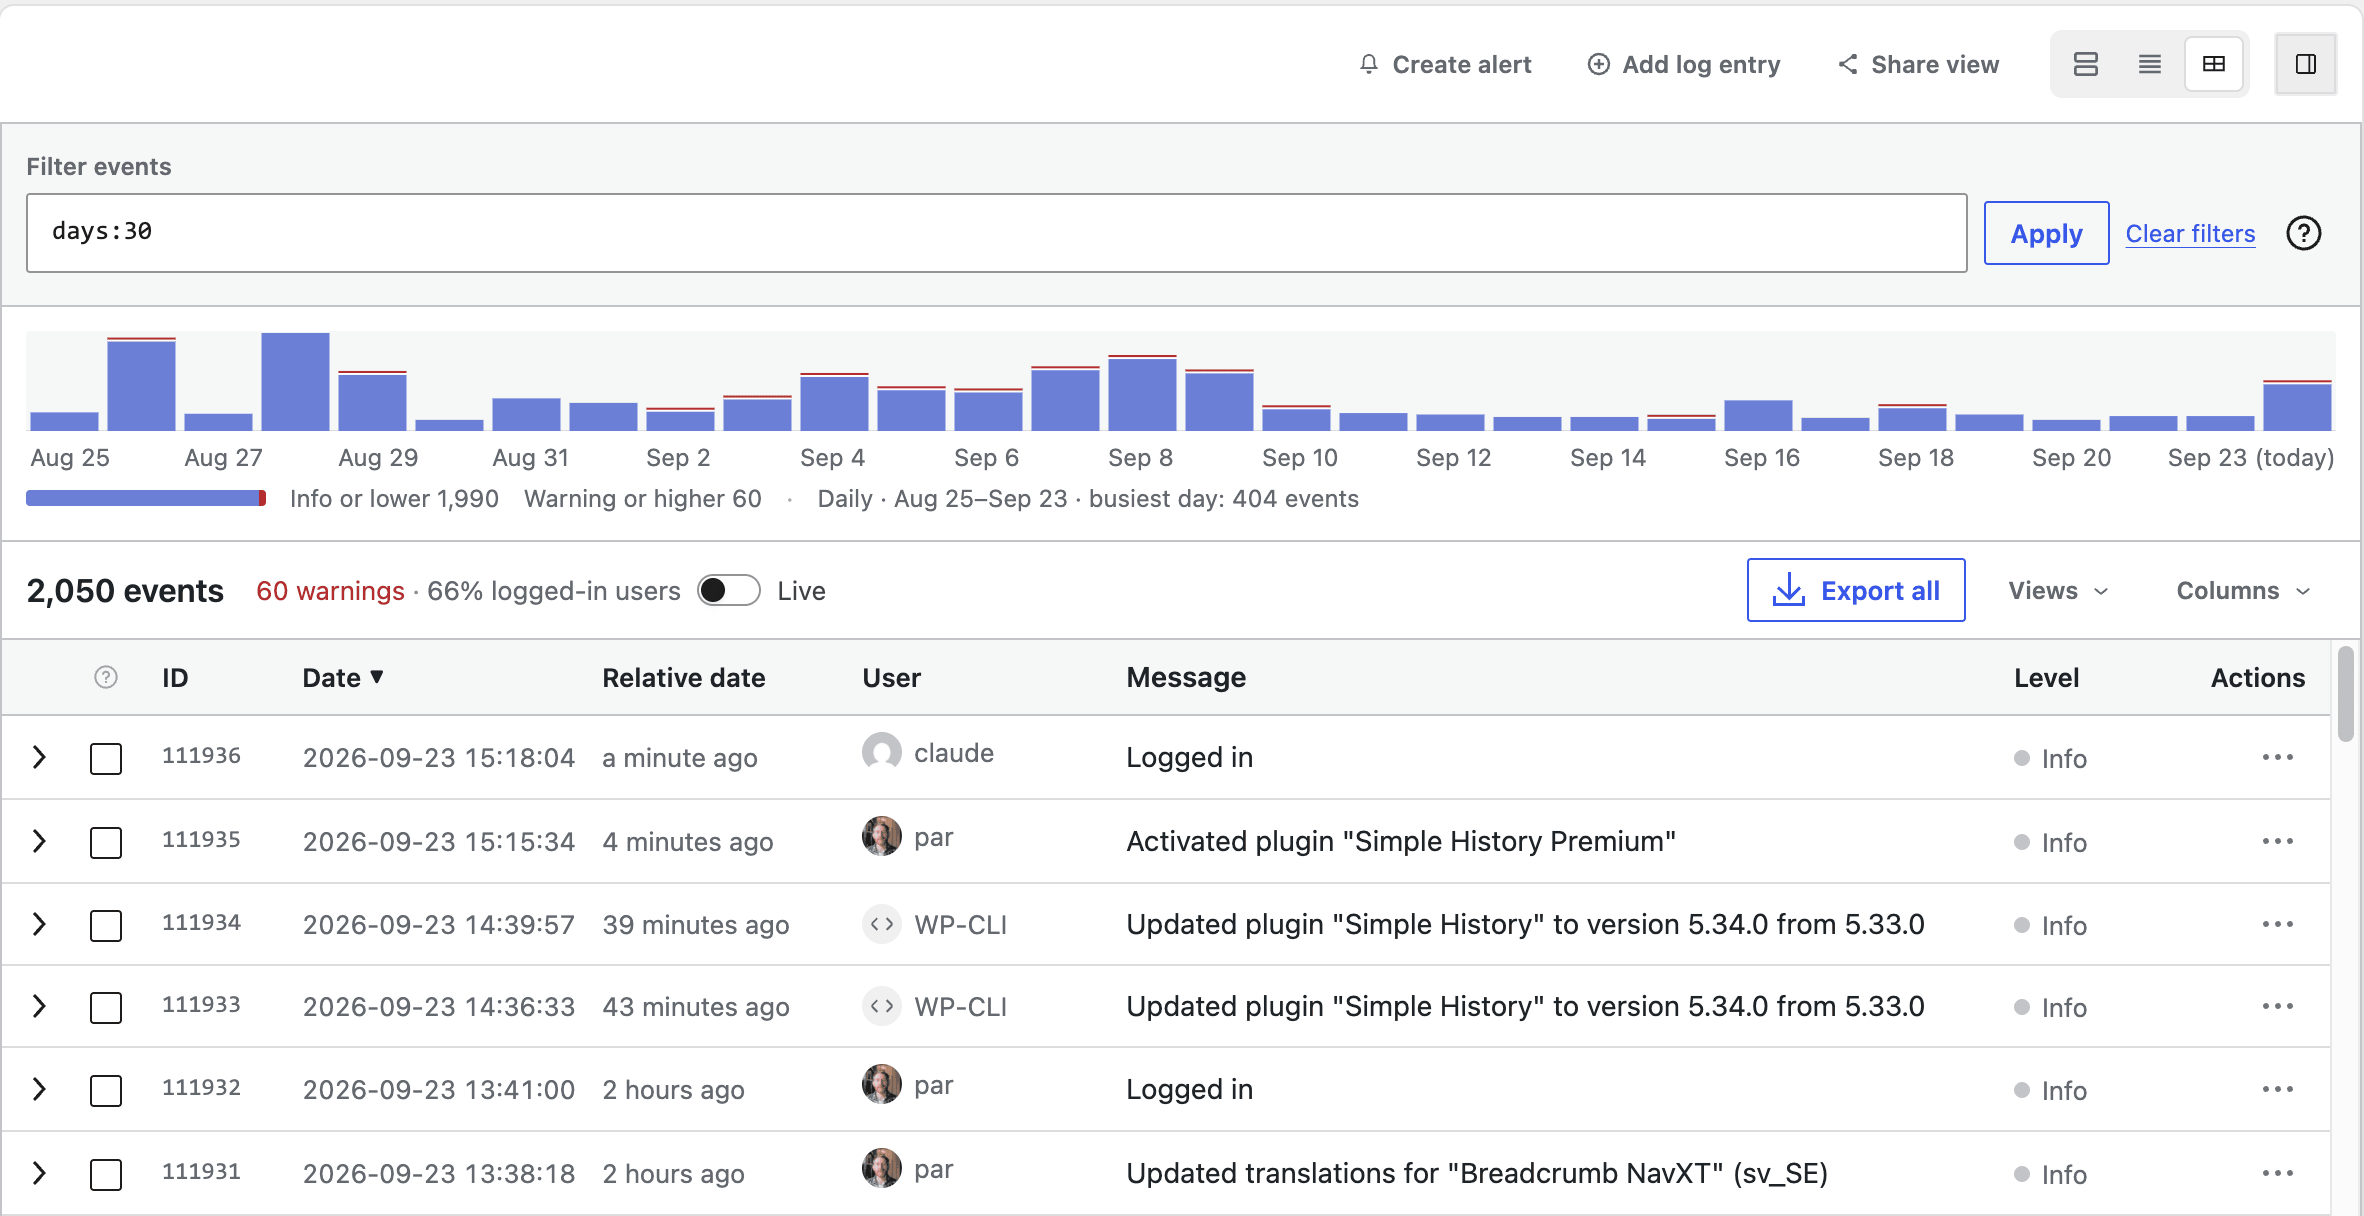
Sort by any column, show the columns you need
Click a column heading to sort by it: date, ID, user, level and more. Sorting by level puts the most serious events first. Pick your own columns under Columns, including a relative date (“3 hours ago”) that is shown by default.
Filter by clicking a value
See a value in the table you want more of, or less of? Click it and choose to show only the matching events, or to hide them. One click instead of opening the filters and picking the same thing from a list.
Or type your filters
The query bar at the top takes the same filters as a short line of text. Handy if you know what you want, and familiar if you have used a log tool like Datadog or Splunk.
level:warning                      only warnings
level:error days:7                 errors from the last 7 days
day:yesterday                      everything from yesterday
meta:jane@example.com              search event details, like emails and user agents
ip:203.0.113.5                     everything from one IP address
-logger:SimpleHistoryLogger deploy search for "deploy", hide Simple History's own eventsCode language: CSS (css)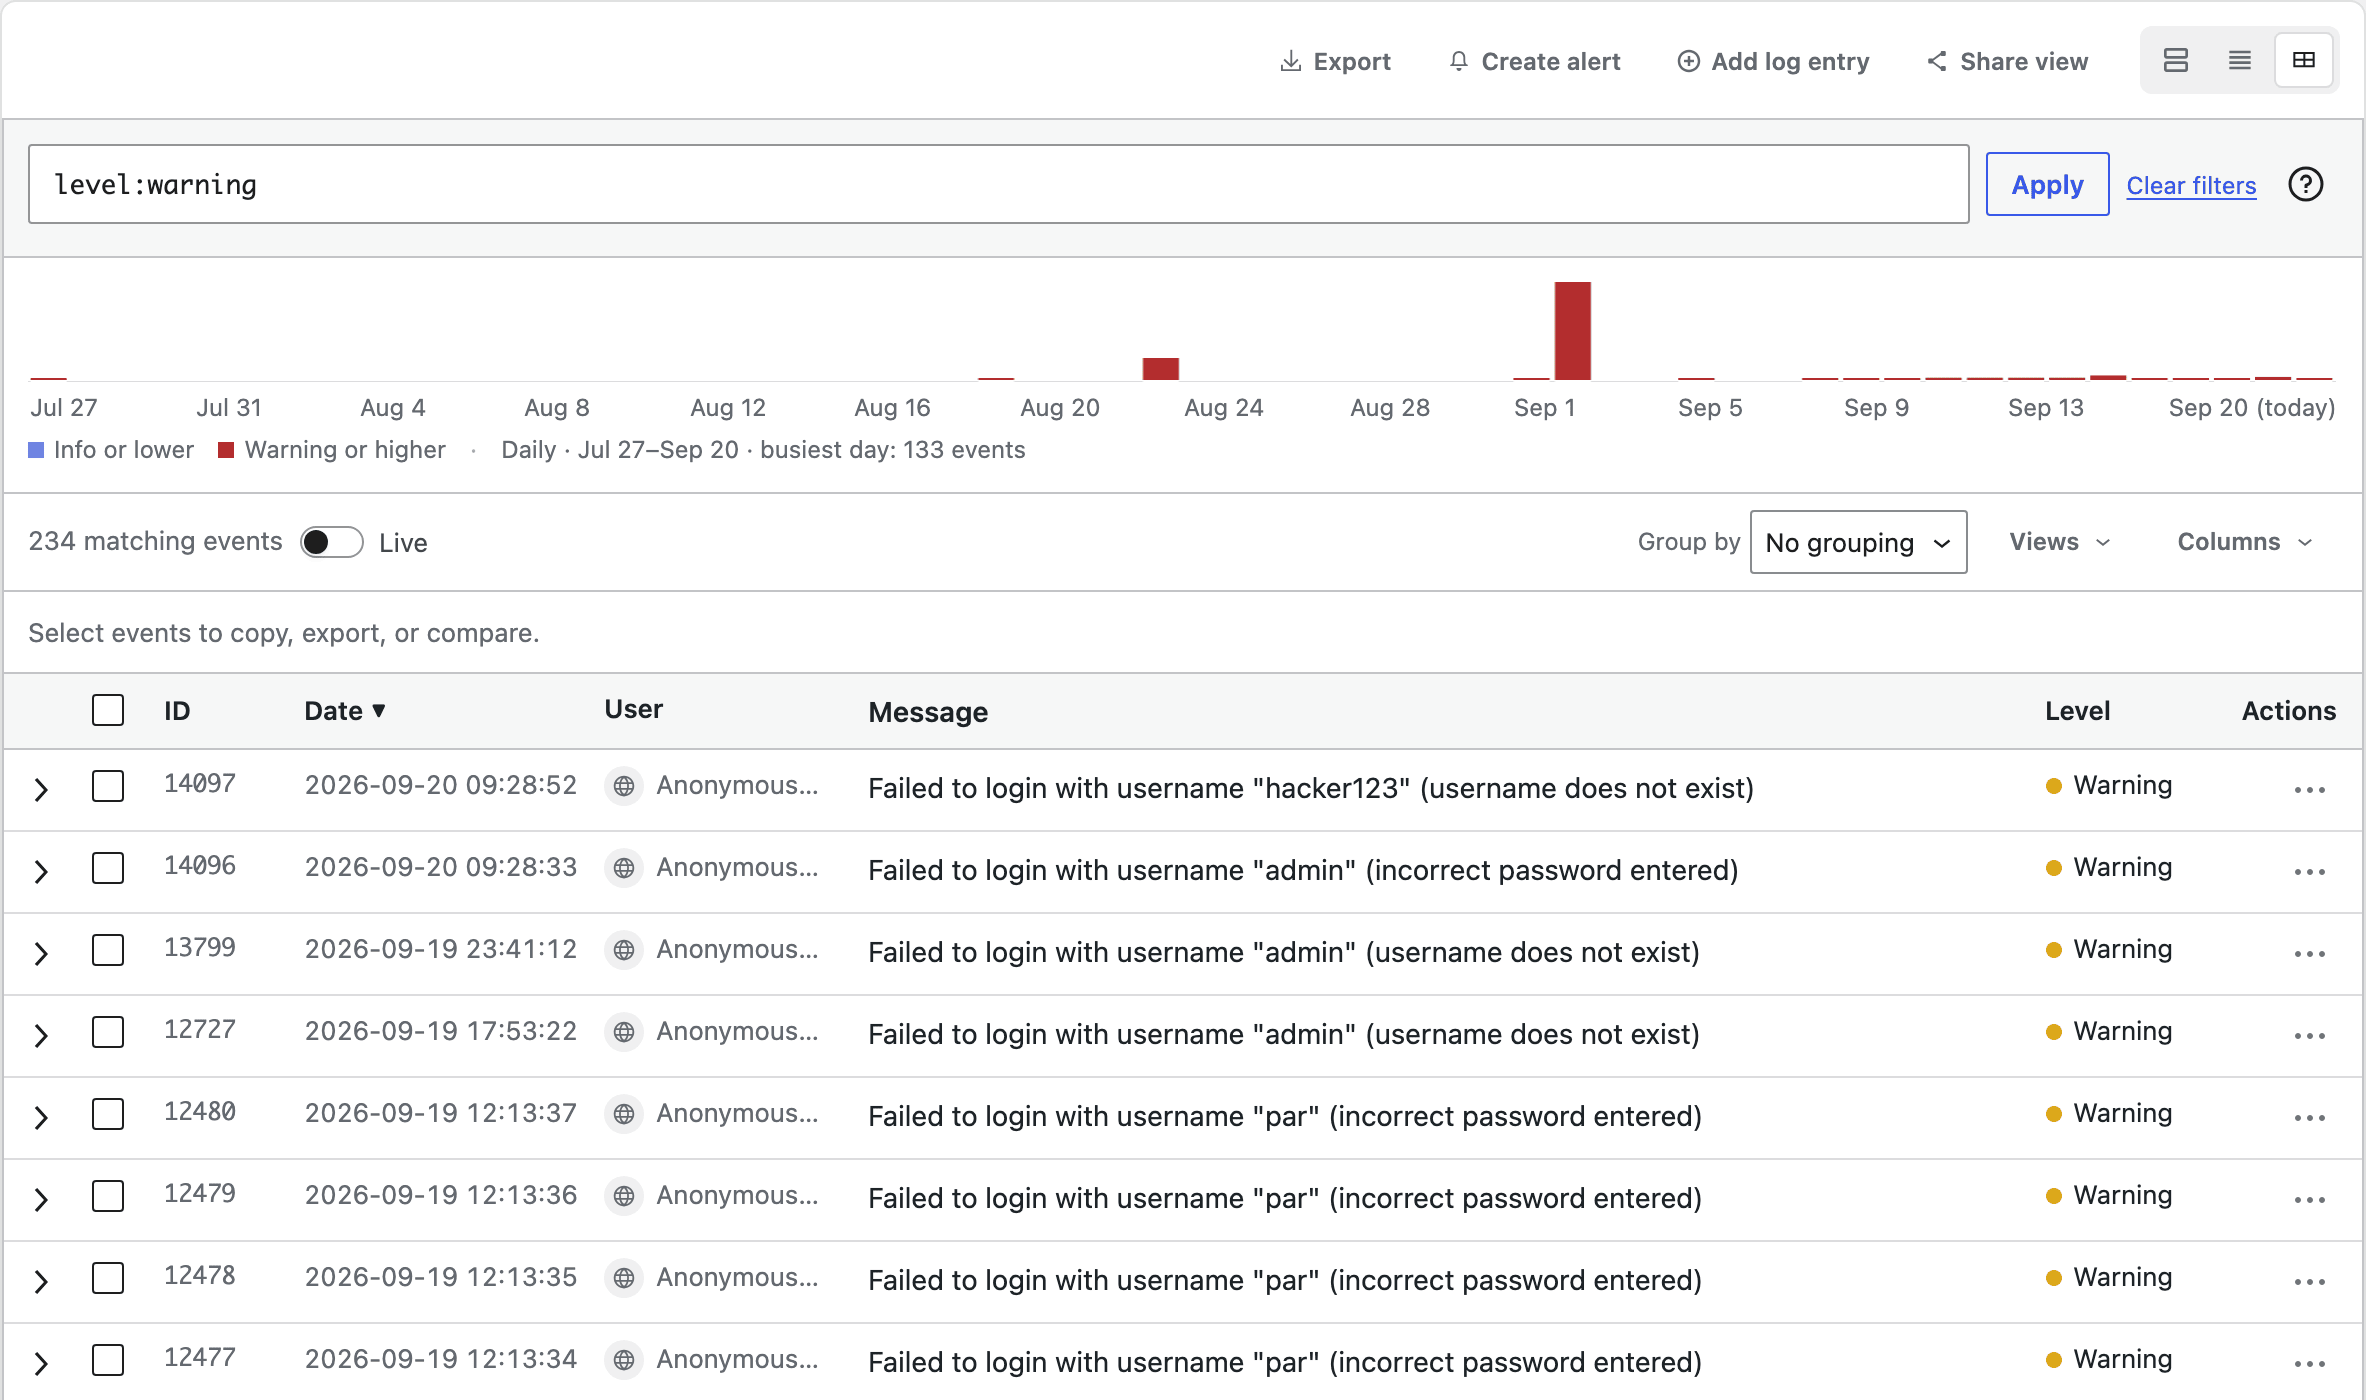
level:warning. The chart shows when they happened.See when things happened
The activity chart above the table shows how many events there were per day, or per hour for shorter periods. Warnings and errors are marked in red, so a bad night stands out. Click a day to filter to it.
Save views you come back to
Found a set of filters you use every week, like “failed logins in the last 7 days”? Save it as a view and get back to it with one click from Views. You can also create an alert from the current filters, so you hear about new matching events right away.
Compare, copy and export
- Select two events and compare them side by side, to see exactly what changed between them.
- Copy selected events as CSV or JSON, or copy links to them to share with a colleague.
- Export all matching events, or only the ones you selected.
- Copy the current filters as a WP-CLI command, to get the same events in the terminal.
How to open it
The table view is part of Simple History Premium (version 1.16.0 or later). Go to Simple History in wp-admin and click the table button in the view switcher above the event list, next to the detailed and compact views. The log remembers your choice.
Simple History Premium starts at $79/year for a single site. Used on 300,000+ WordPress sites, rated 4.9★ across 490+ reviews.
$ 79
/year
- Billed annually
- Options available:
- 1 site: $79/year
- 5 sites: $199/year ($39.80 per site)
- 10 sites: $299/year ($29.90 per site)
- 50 sites – $499 ($9.98 per site)
- 500 sites – $1199 ($2.40 per site)
| Version: | 1.16.0 |
| Last update: | September 2026 |
What’s included
- Premium Plugin
- 1-year of plugin updates (includes new features & security updates)
Version history
- See releases archive
Requirements
- WordPress 6.3 or higher
- Simple History 5.34.0 or higher
- PHP 7.4 or higher