
Simple History Premium can forward every WordPress activity event — logins, post edits, plugin changes, failed logins — to Splunk as it happens. Switch the Splunk channel on and WordPress stops sitting in a database only WordPress can read: the events land in your existing searches, dashboards and alerts, with the user behind each change attached.
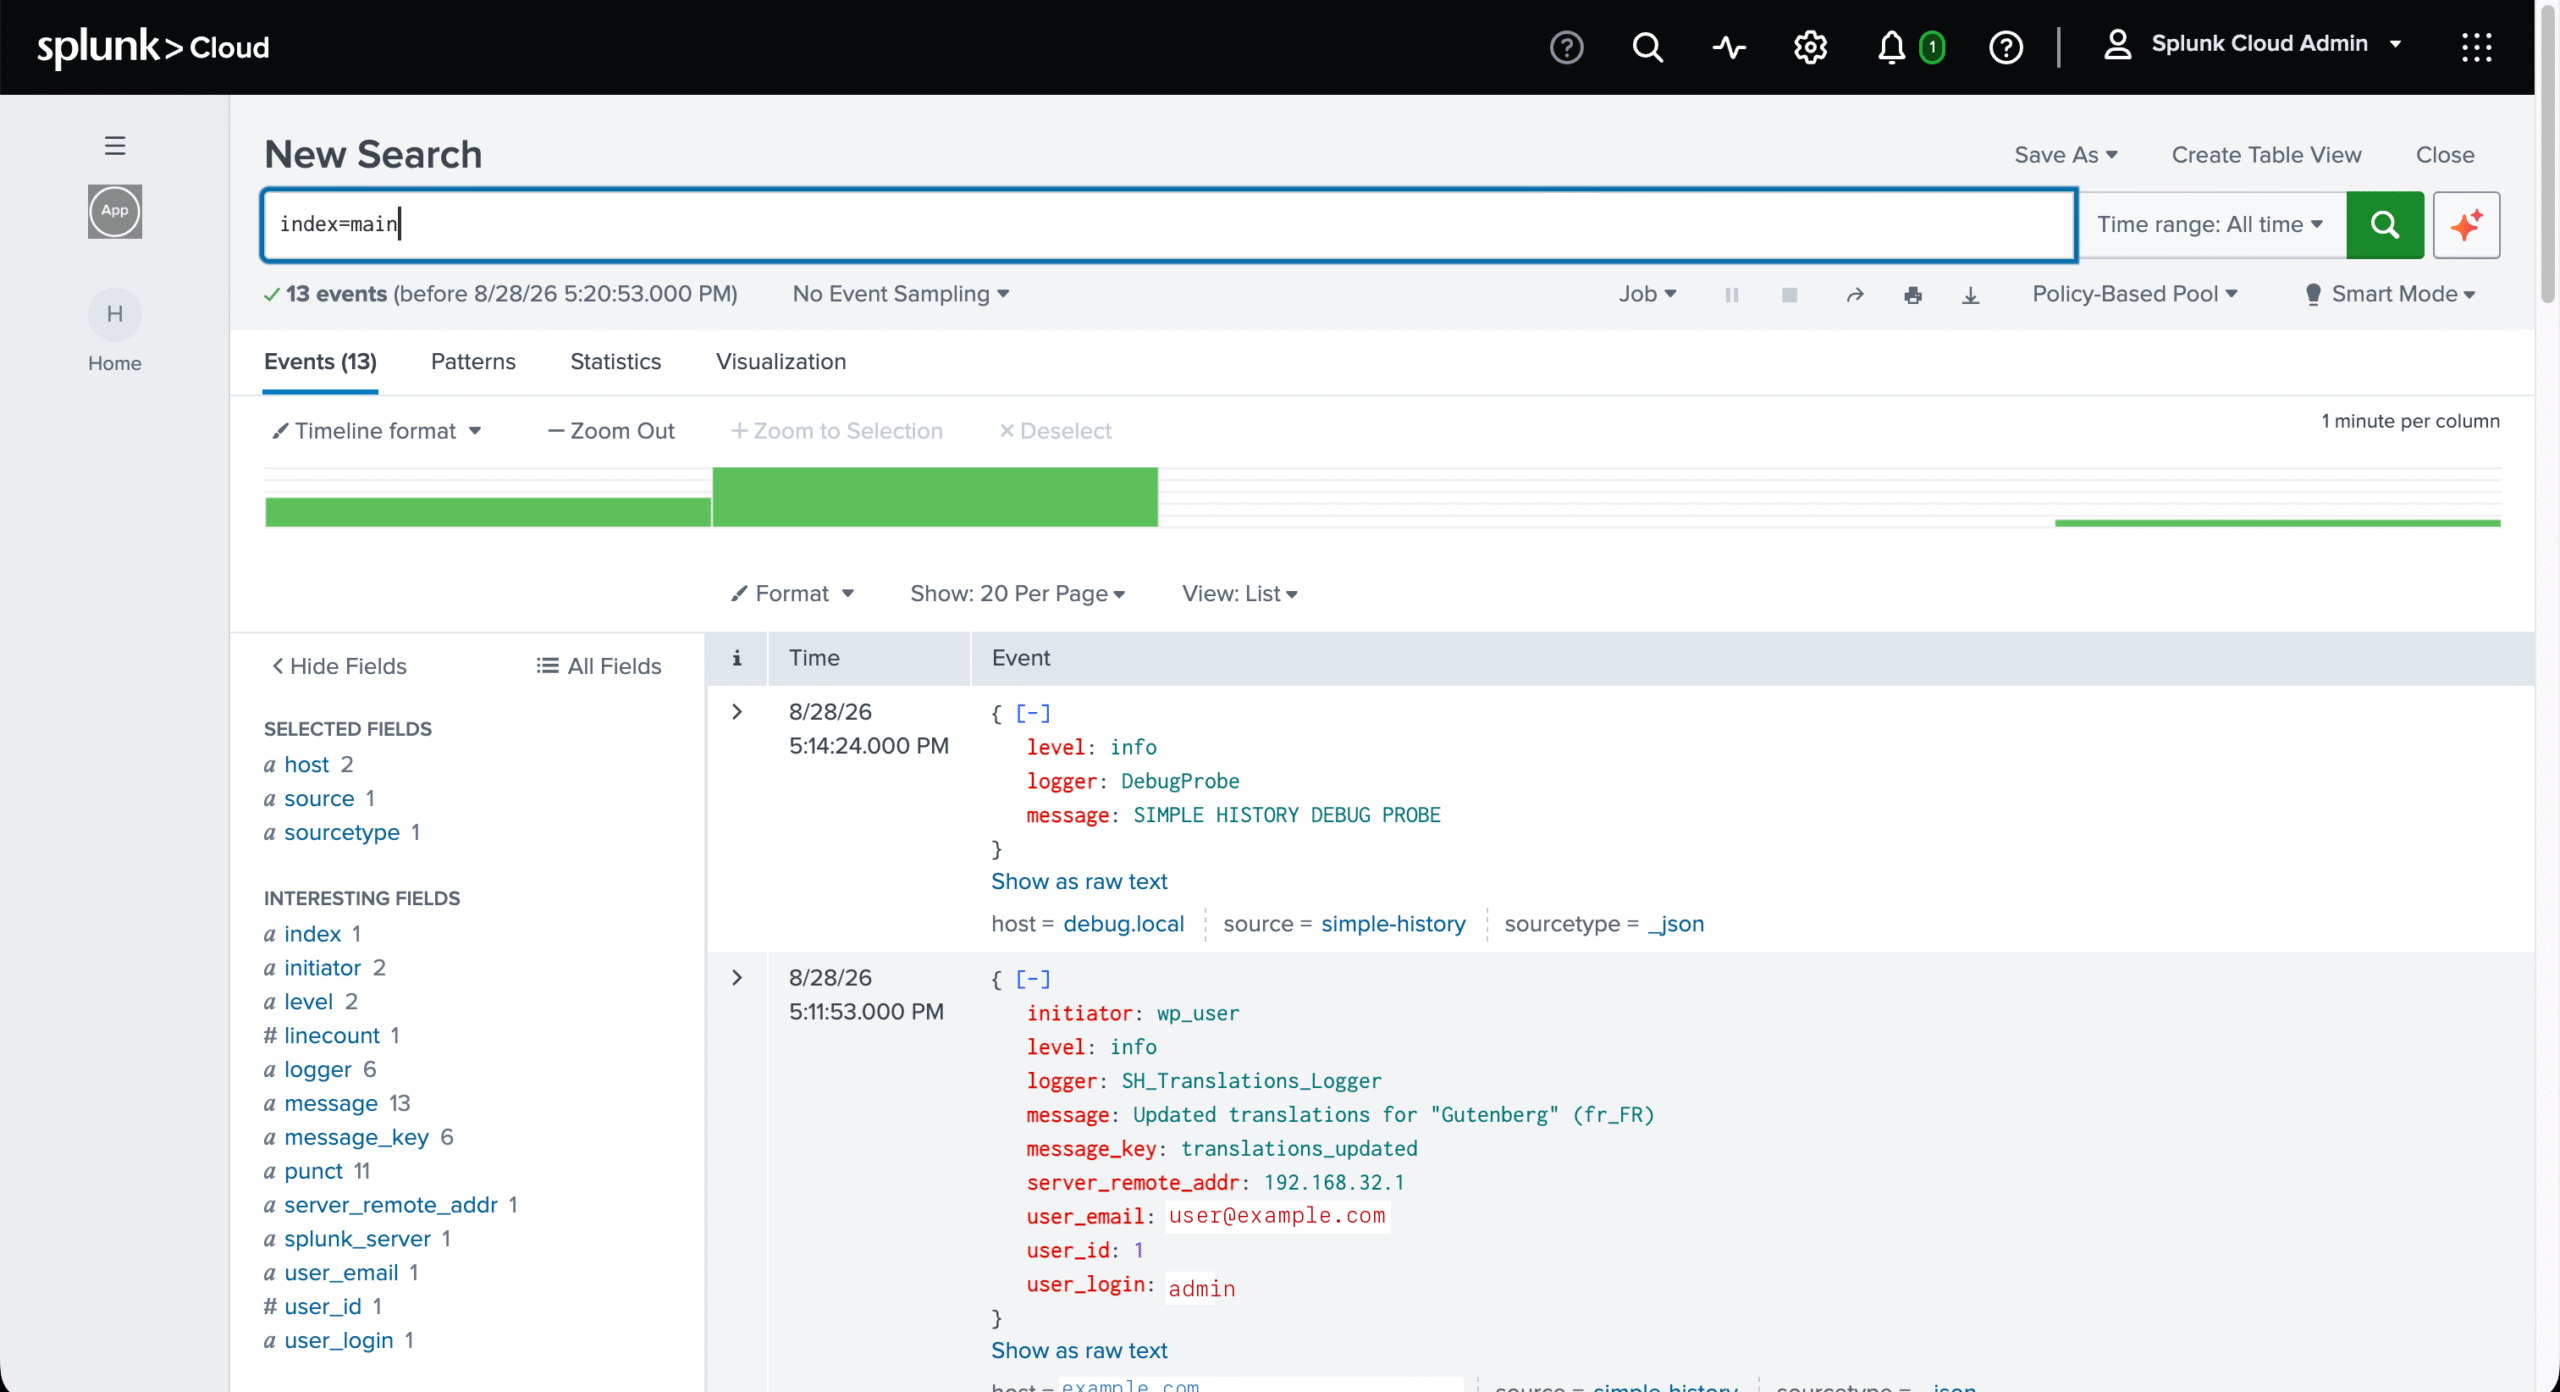
Once enabled, events go to Splunk’s HTTP Event Collector (HEC) as JSON, one event per action. You need three things: a Splunk stack, HEC switched on, and a token allowed to write to your index. This guide covers all three, and then the part people get stuck on — confirming the events actually arrived.
Splunk is one of several log forwarding destinations in Simple History Premium. The free plugin can write events to a local log file, but only as human-readable text. The structured formats that log tools ingest cleanly — JSON Lines, Logfmt, RFC 5424 — and sending to HEC are both part of Premium.
The HEC URL is not the URL you log in to
This is the single most common mistake, so it is worth getting out of the way first. The welcome email from Splunk Cloud Platform gives you a Splunk Cloud Platform URL. That is the web interface. HEC listens somewhere else, on a different host name, a different port, or both.
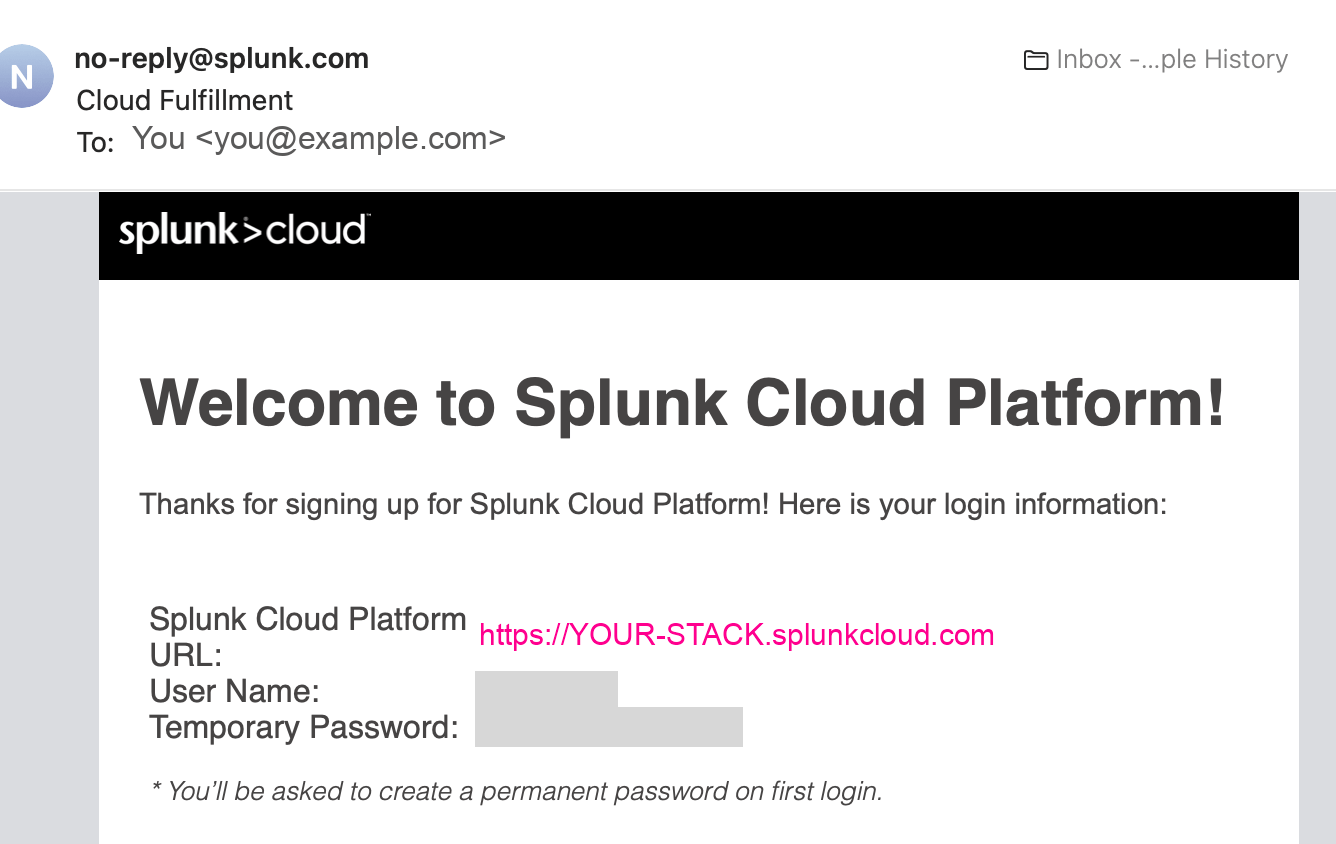
Use whichever of these matches your setup, replacing YOUR-STACK with your own stack name:
| Setup | HEC URL |
|---|---|
| Splunk Cloud on AWS | https://http-inputs-YOUR-STACK.splunkcloud.com:443 |
| Splunk Cloud on Google Cloud | https://http-inputs.YOUR-STACK.splunkcloud.com:443 (a dot, not a hyphen) |
| Splunk Cloud free trial | https://YOUR-STACK.splunkcloud.com:8088 (no prefix) |
| Self-hosted Splunk | https://YOUR-SERVER:8088 |
If you post to the web interface address instead, Splunk answers HTTP 413: Unexpected request data received. That reads like a message about request size, but it means you reached the wrong endpoint.
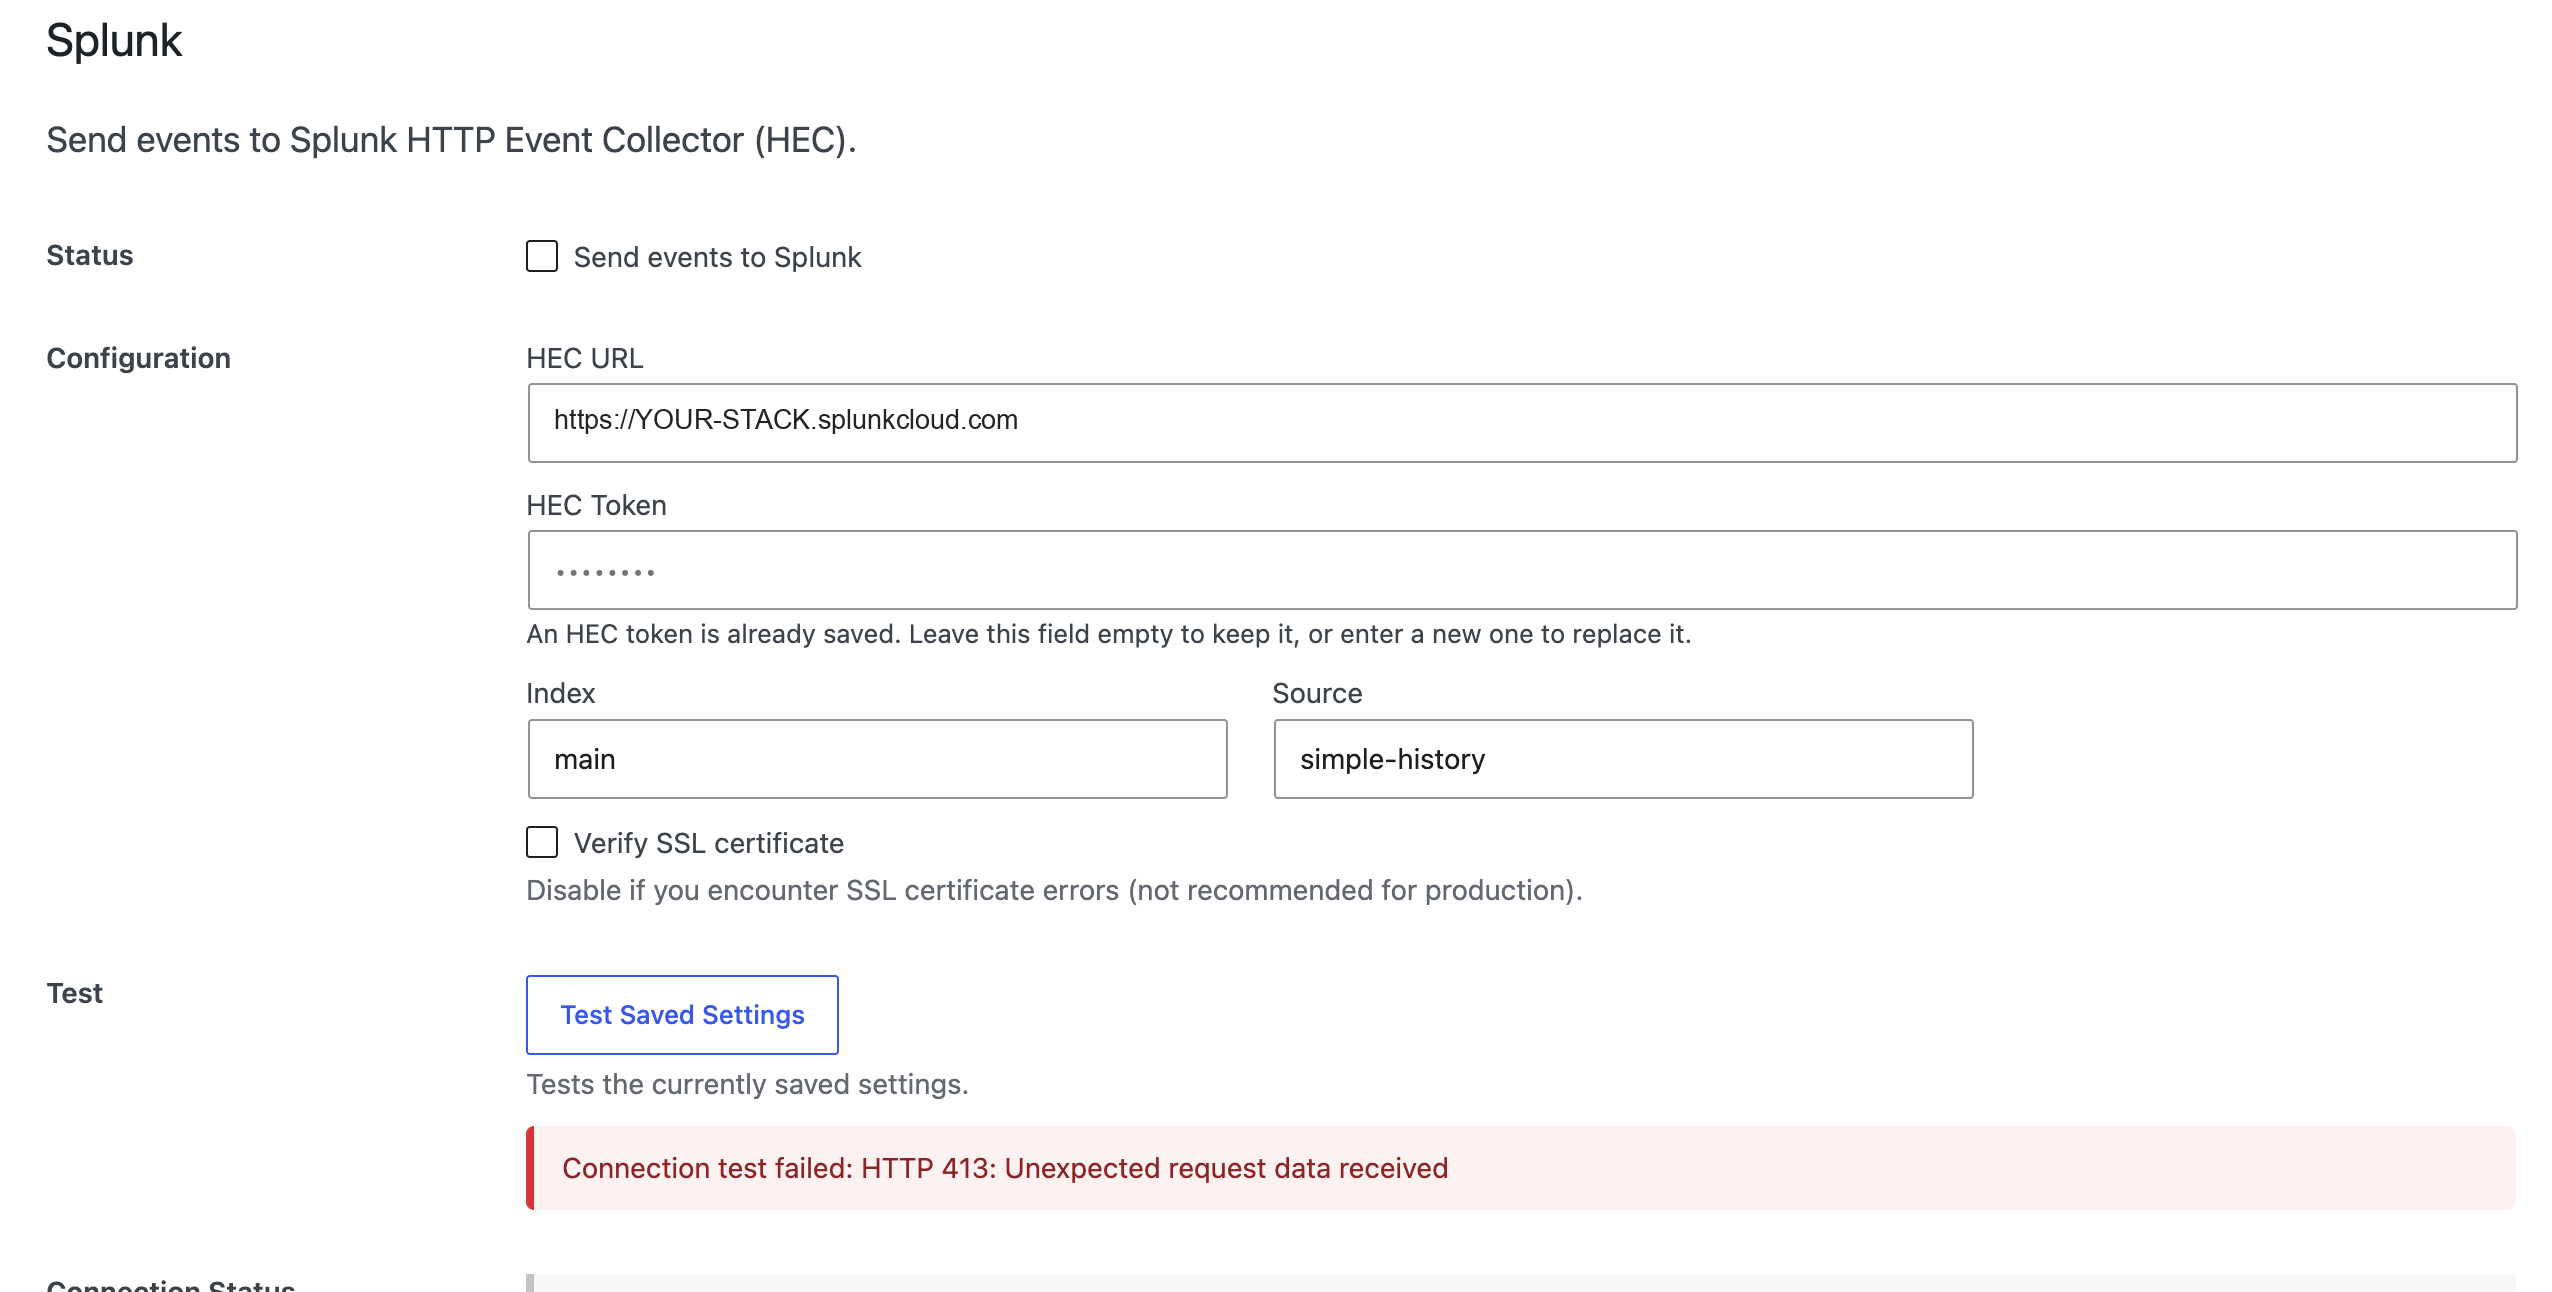
Turn on HEC and create a token in Splunk
- In Splunk, open Settings and choose Data inputs.
- Select HTTP Event Collector.
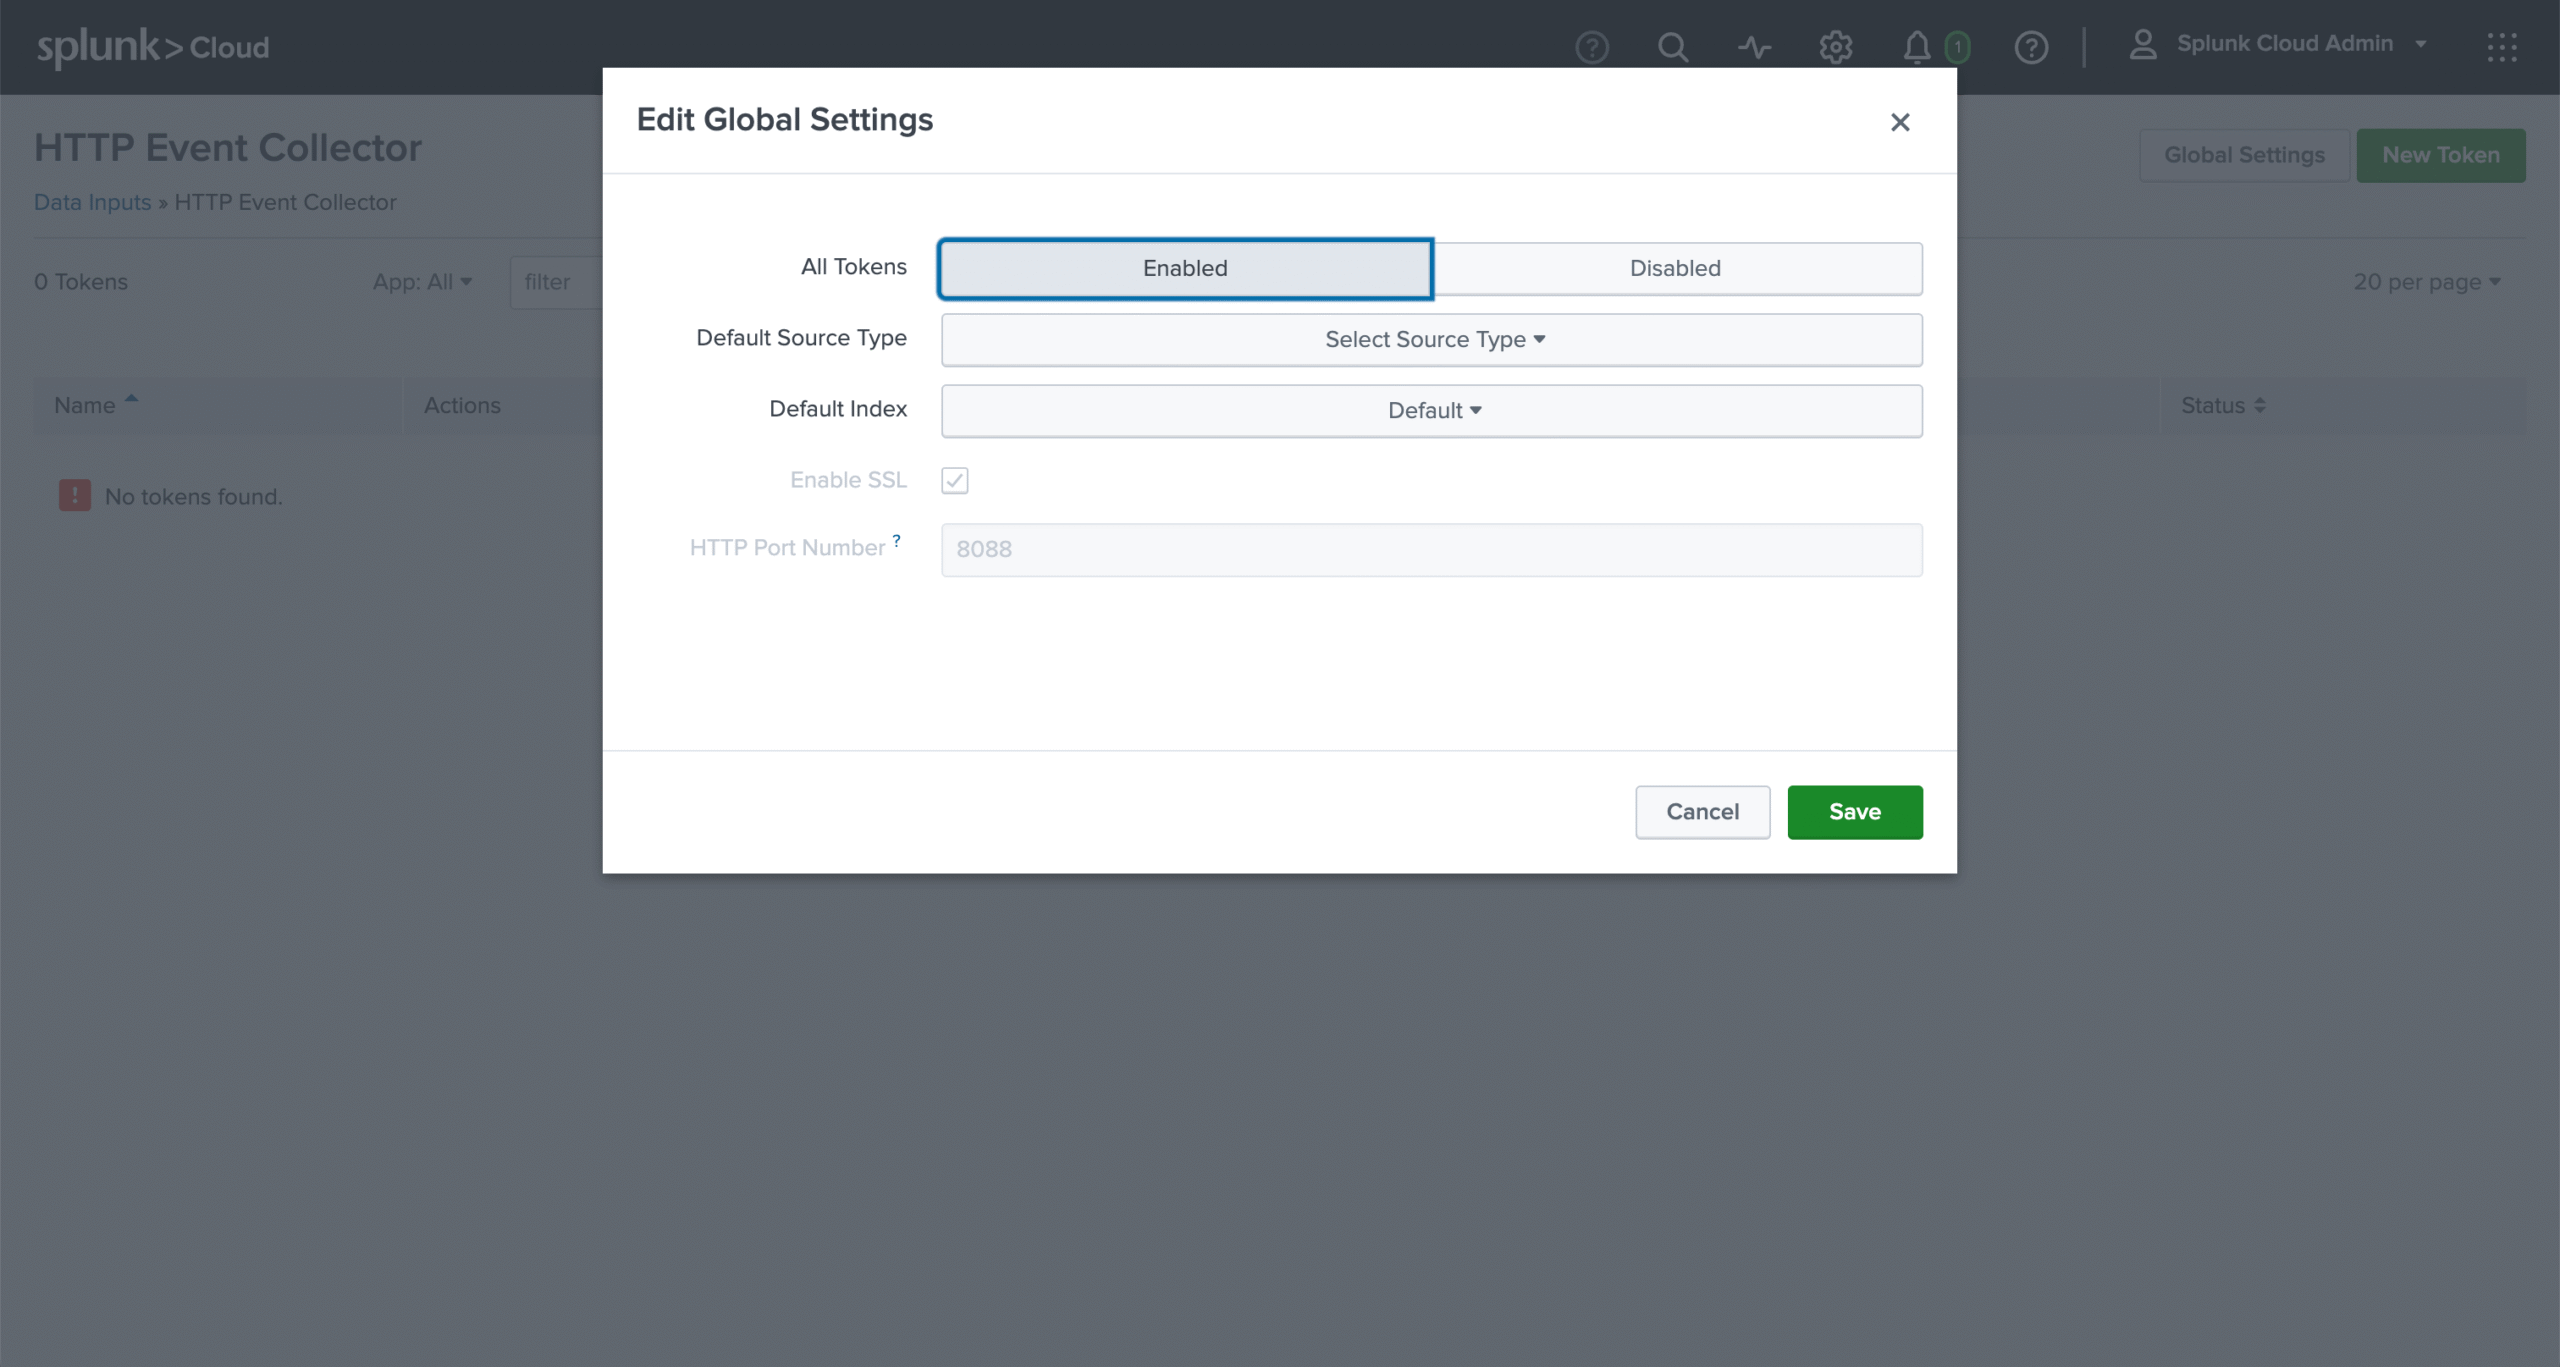
- Open Global Settings and set All Tokens to Enabled. On a new stack this is often off, and nothing works until it is on.
- Choose New Token and give it a name that identifies the site sending the events, such as
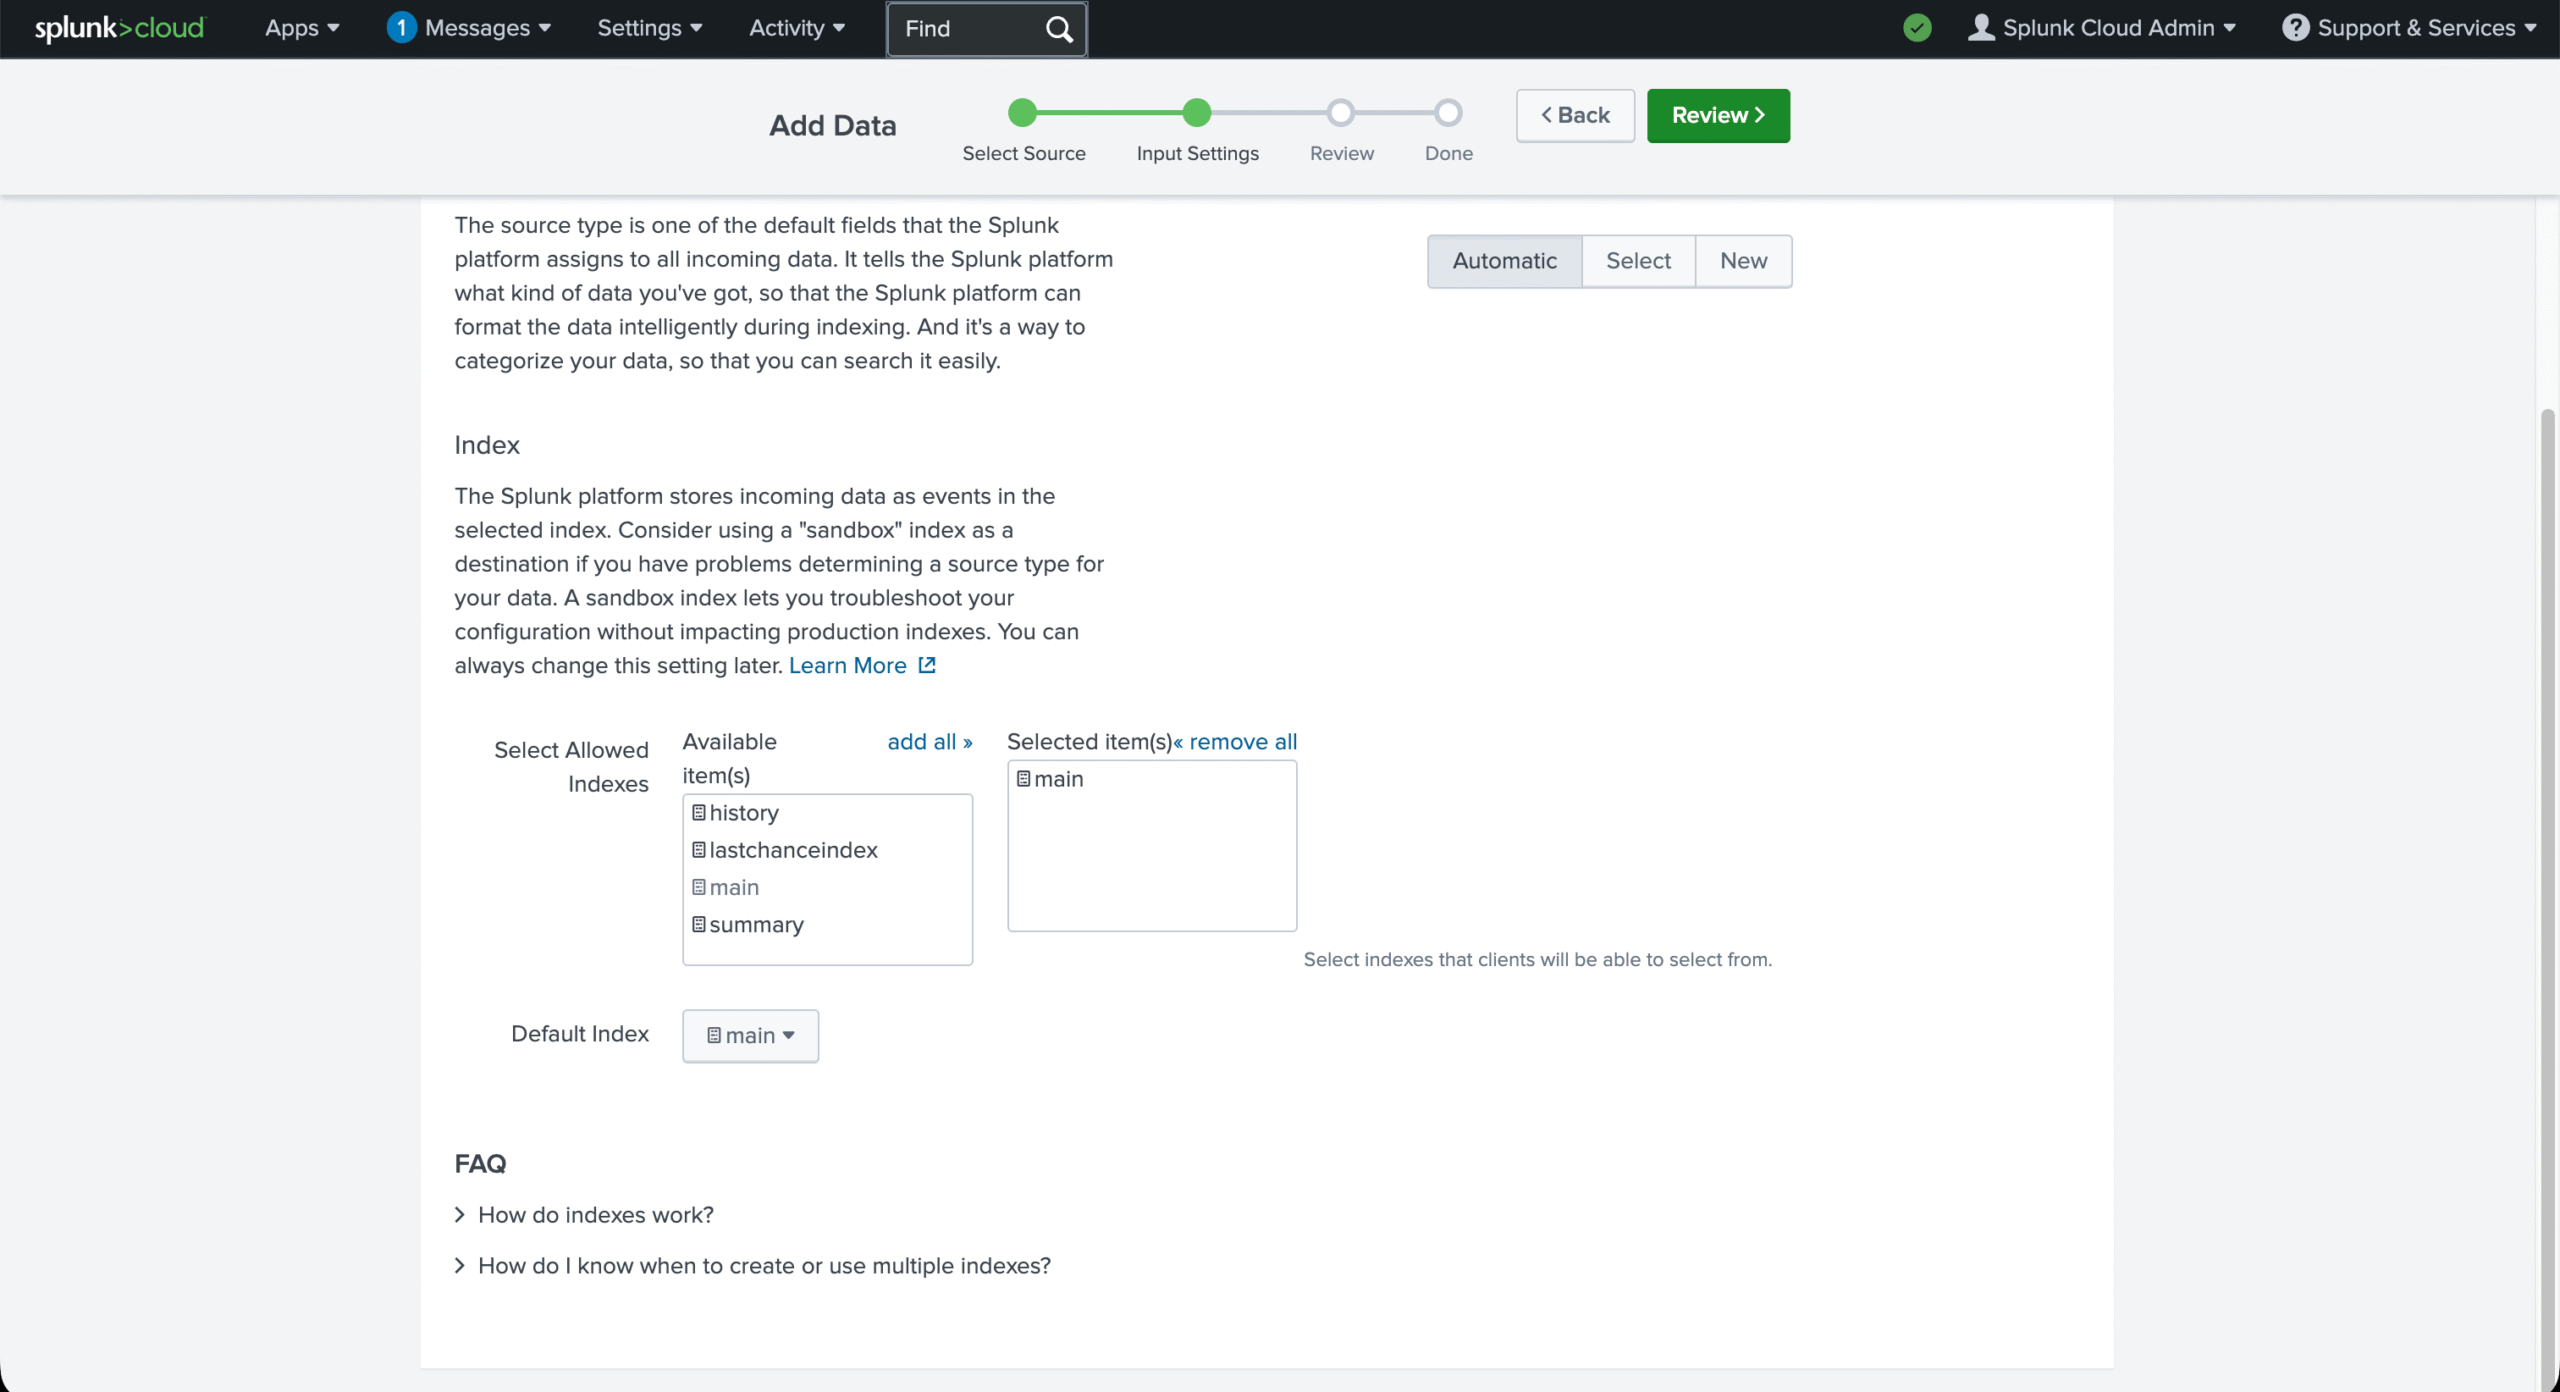
simple-history-example-com. - Under Select Allowed Indexes, add the index you want to write to, and set the same index as Default Index.
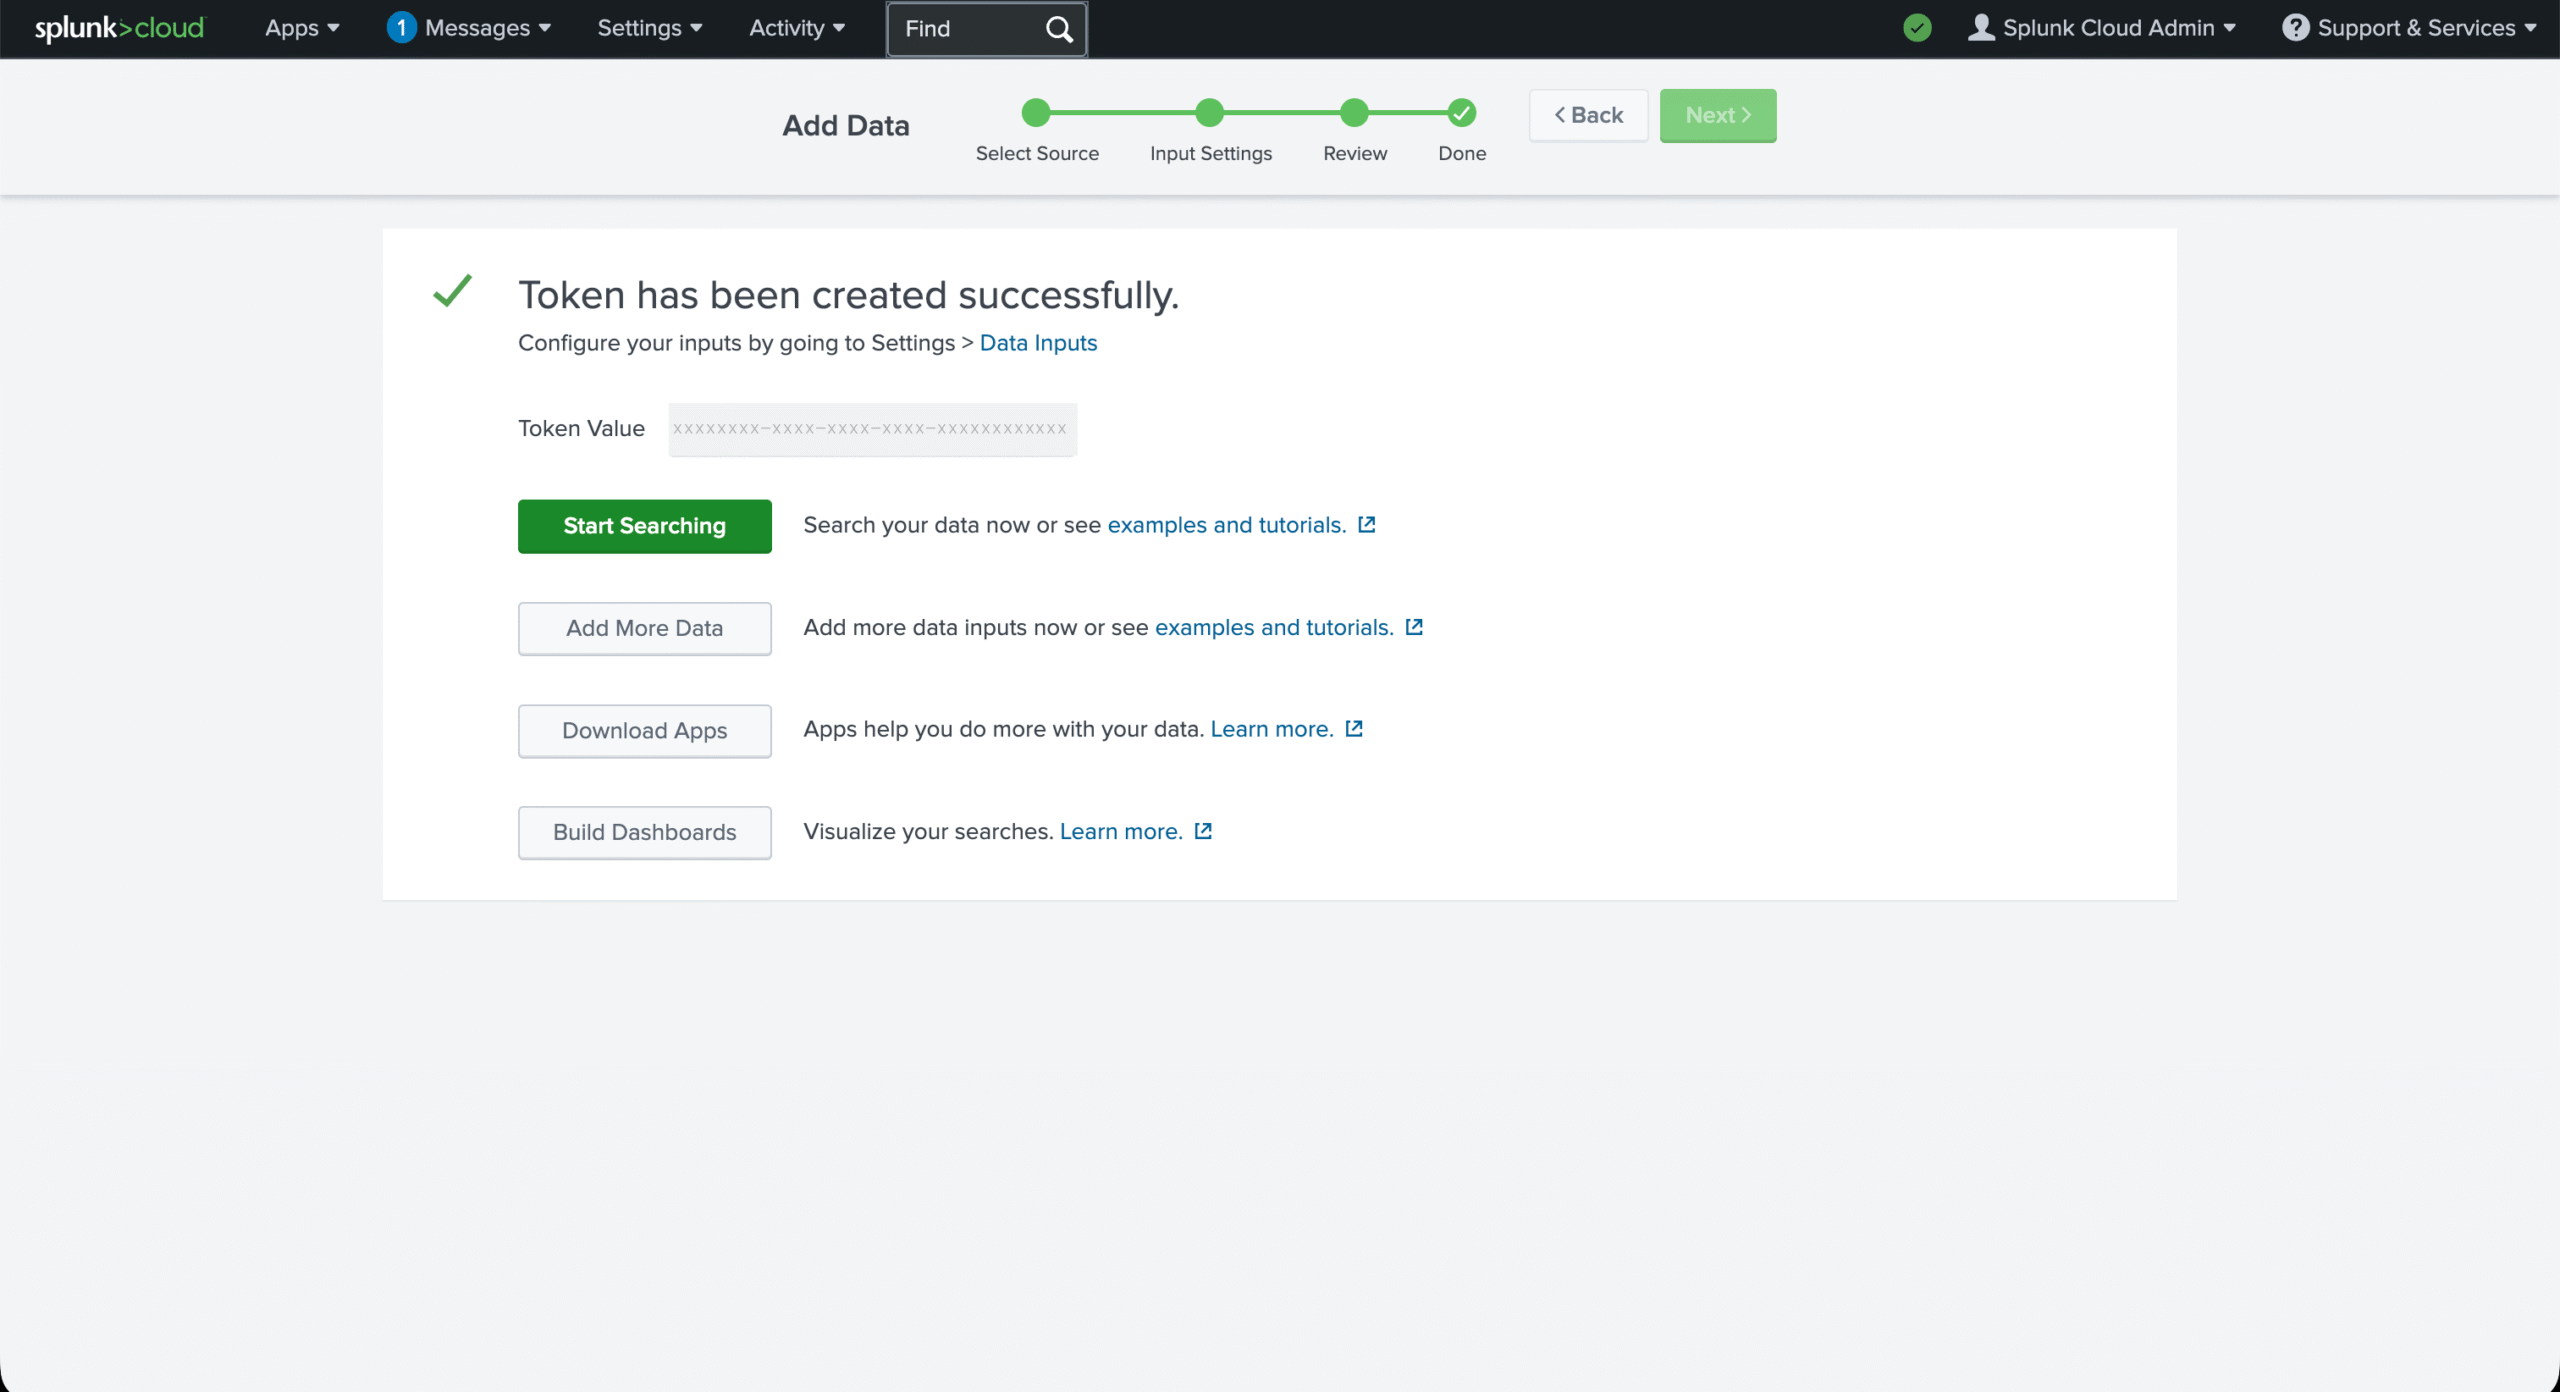
- Copy the Token Value. It is a UUID, not the name you just typed, and the field may cut it off visually — select the whole value before copying.
Add the token in WordPress
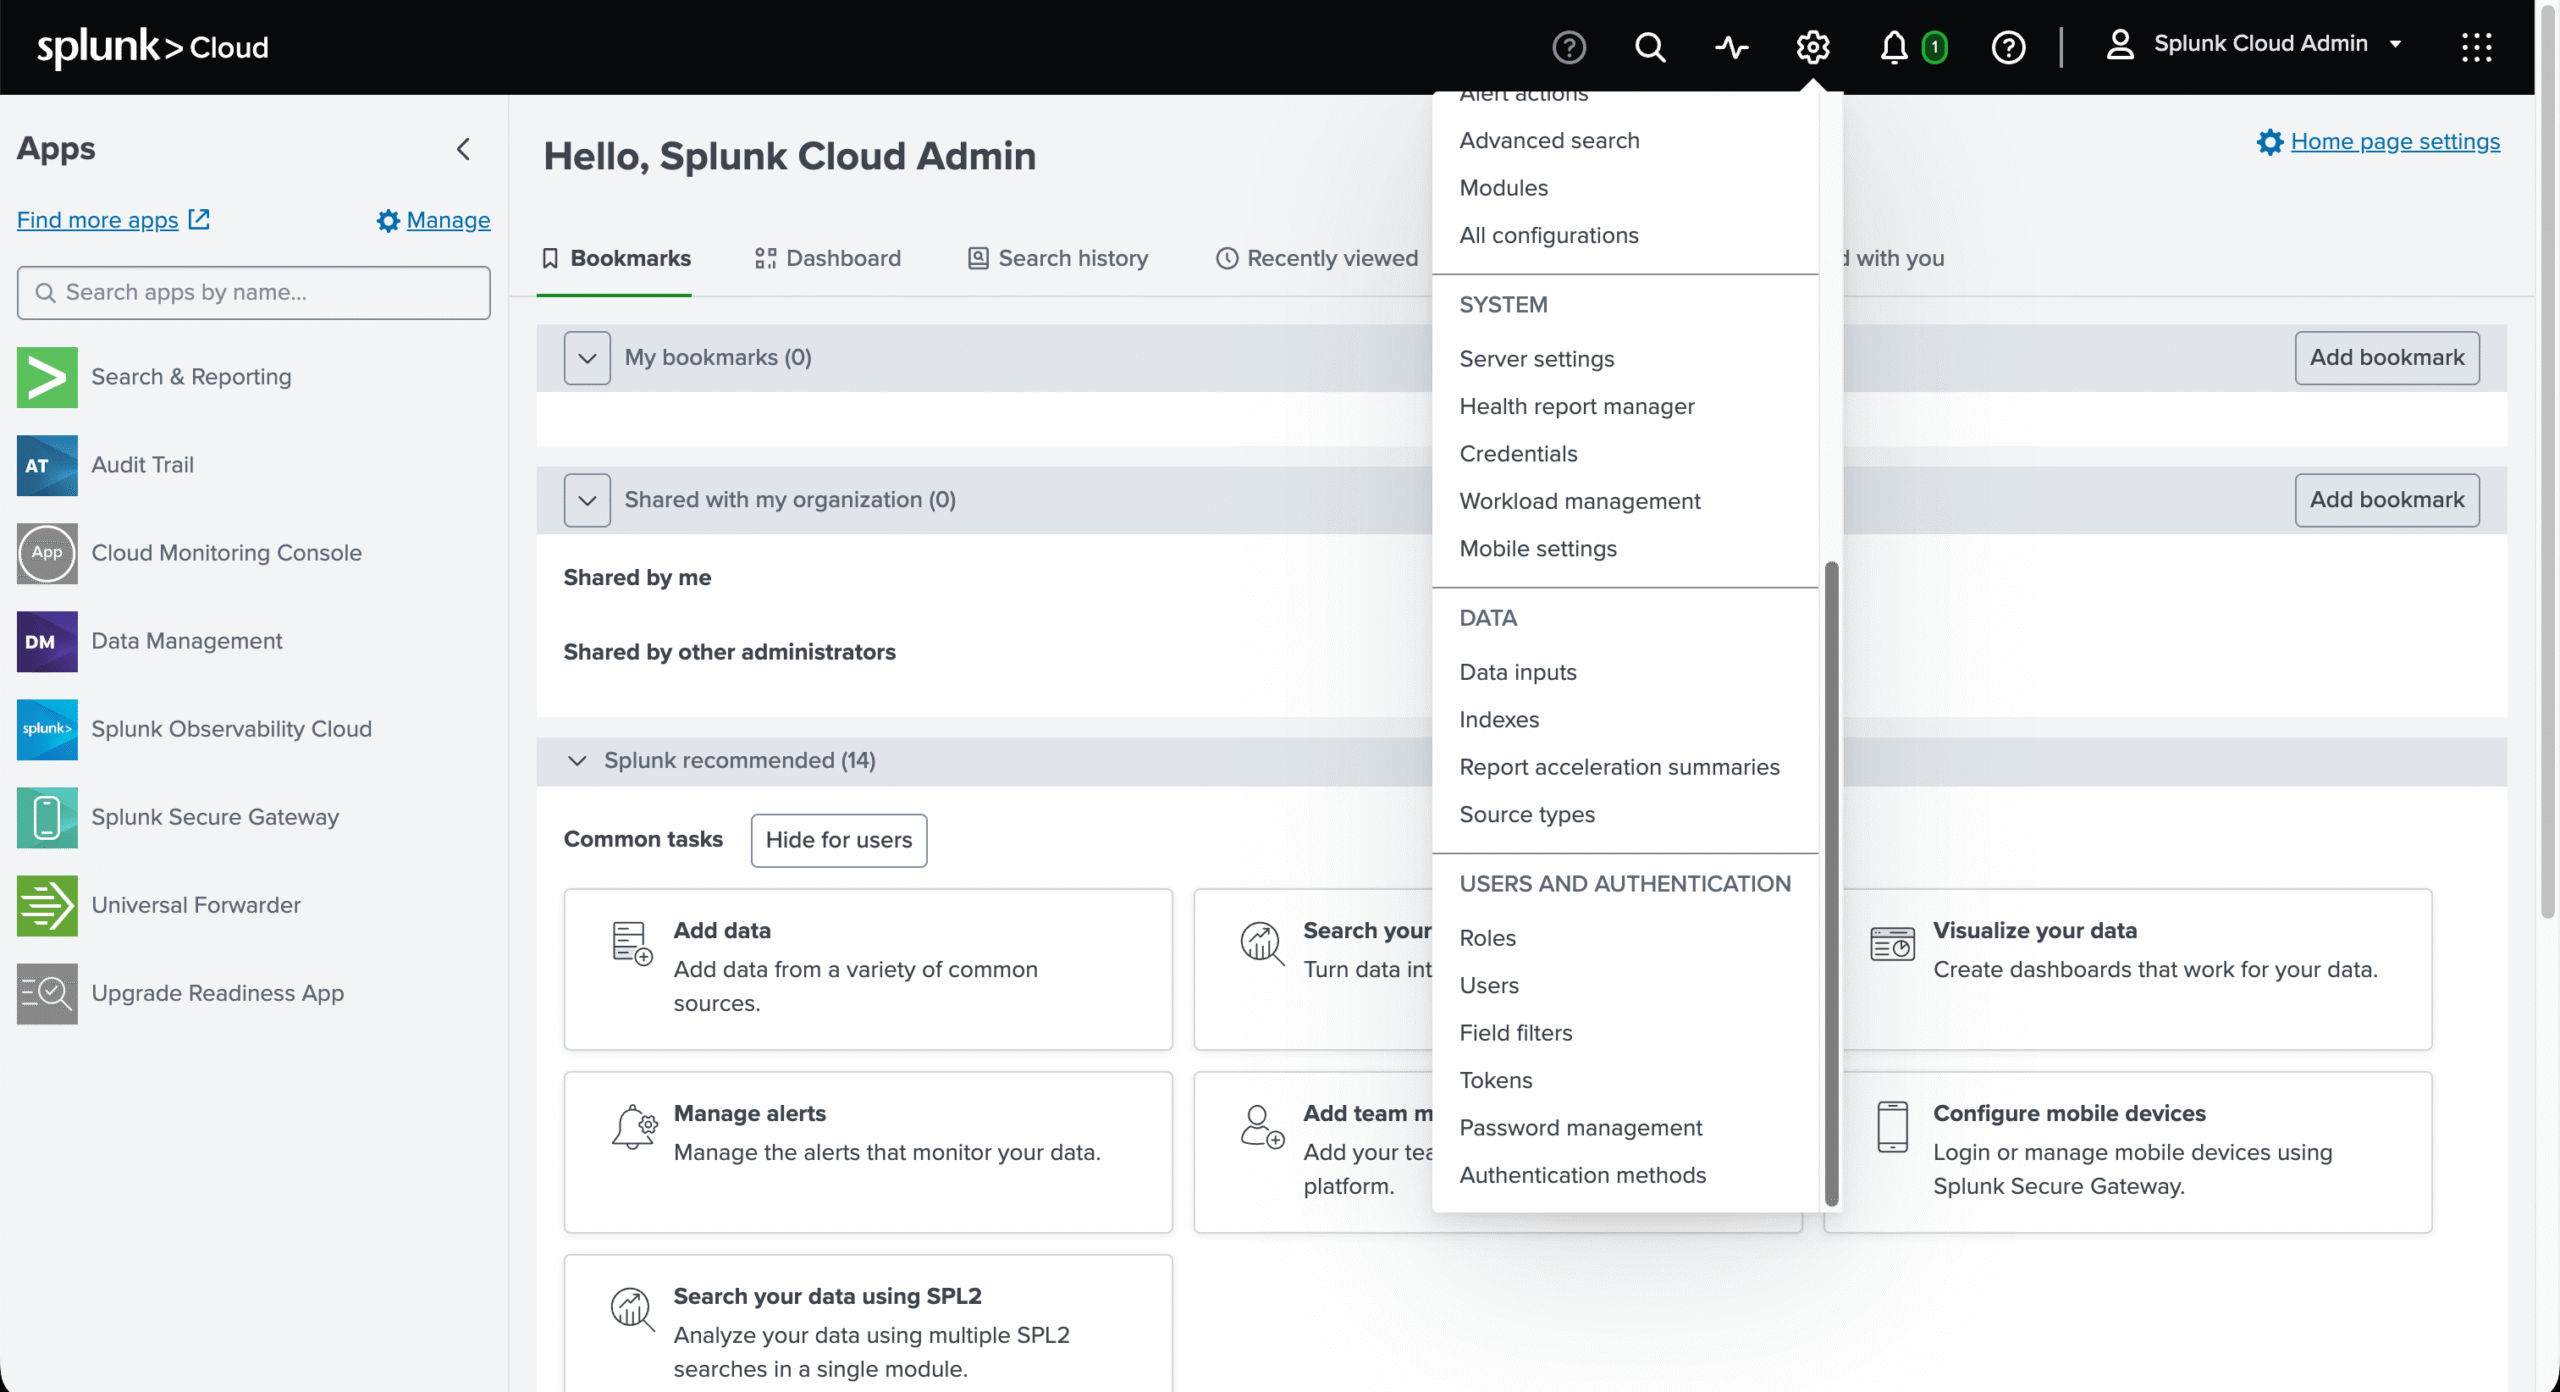
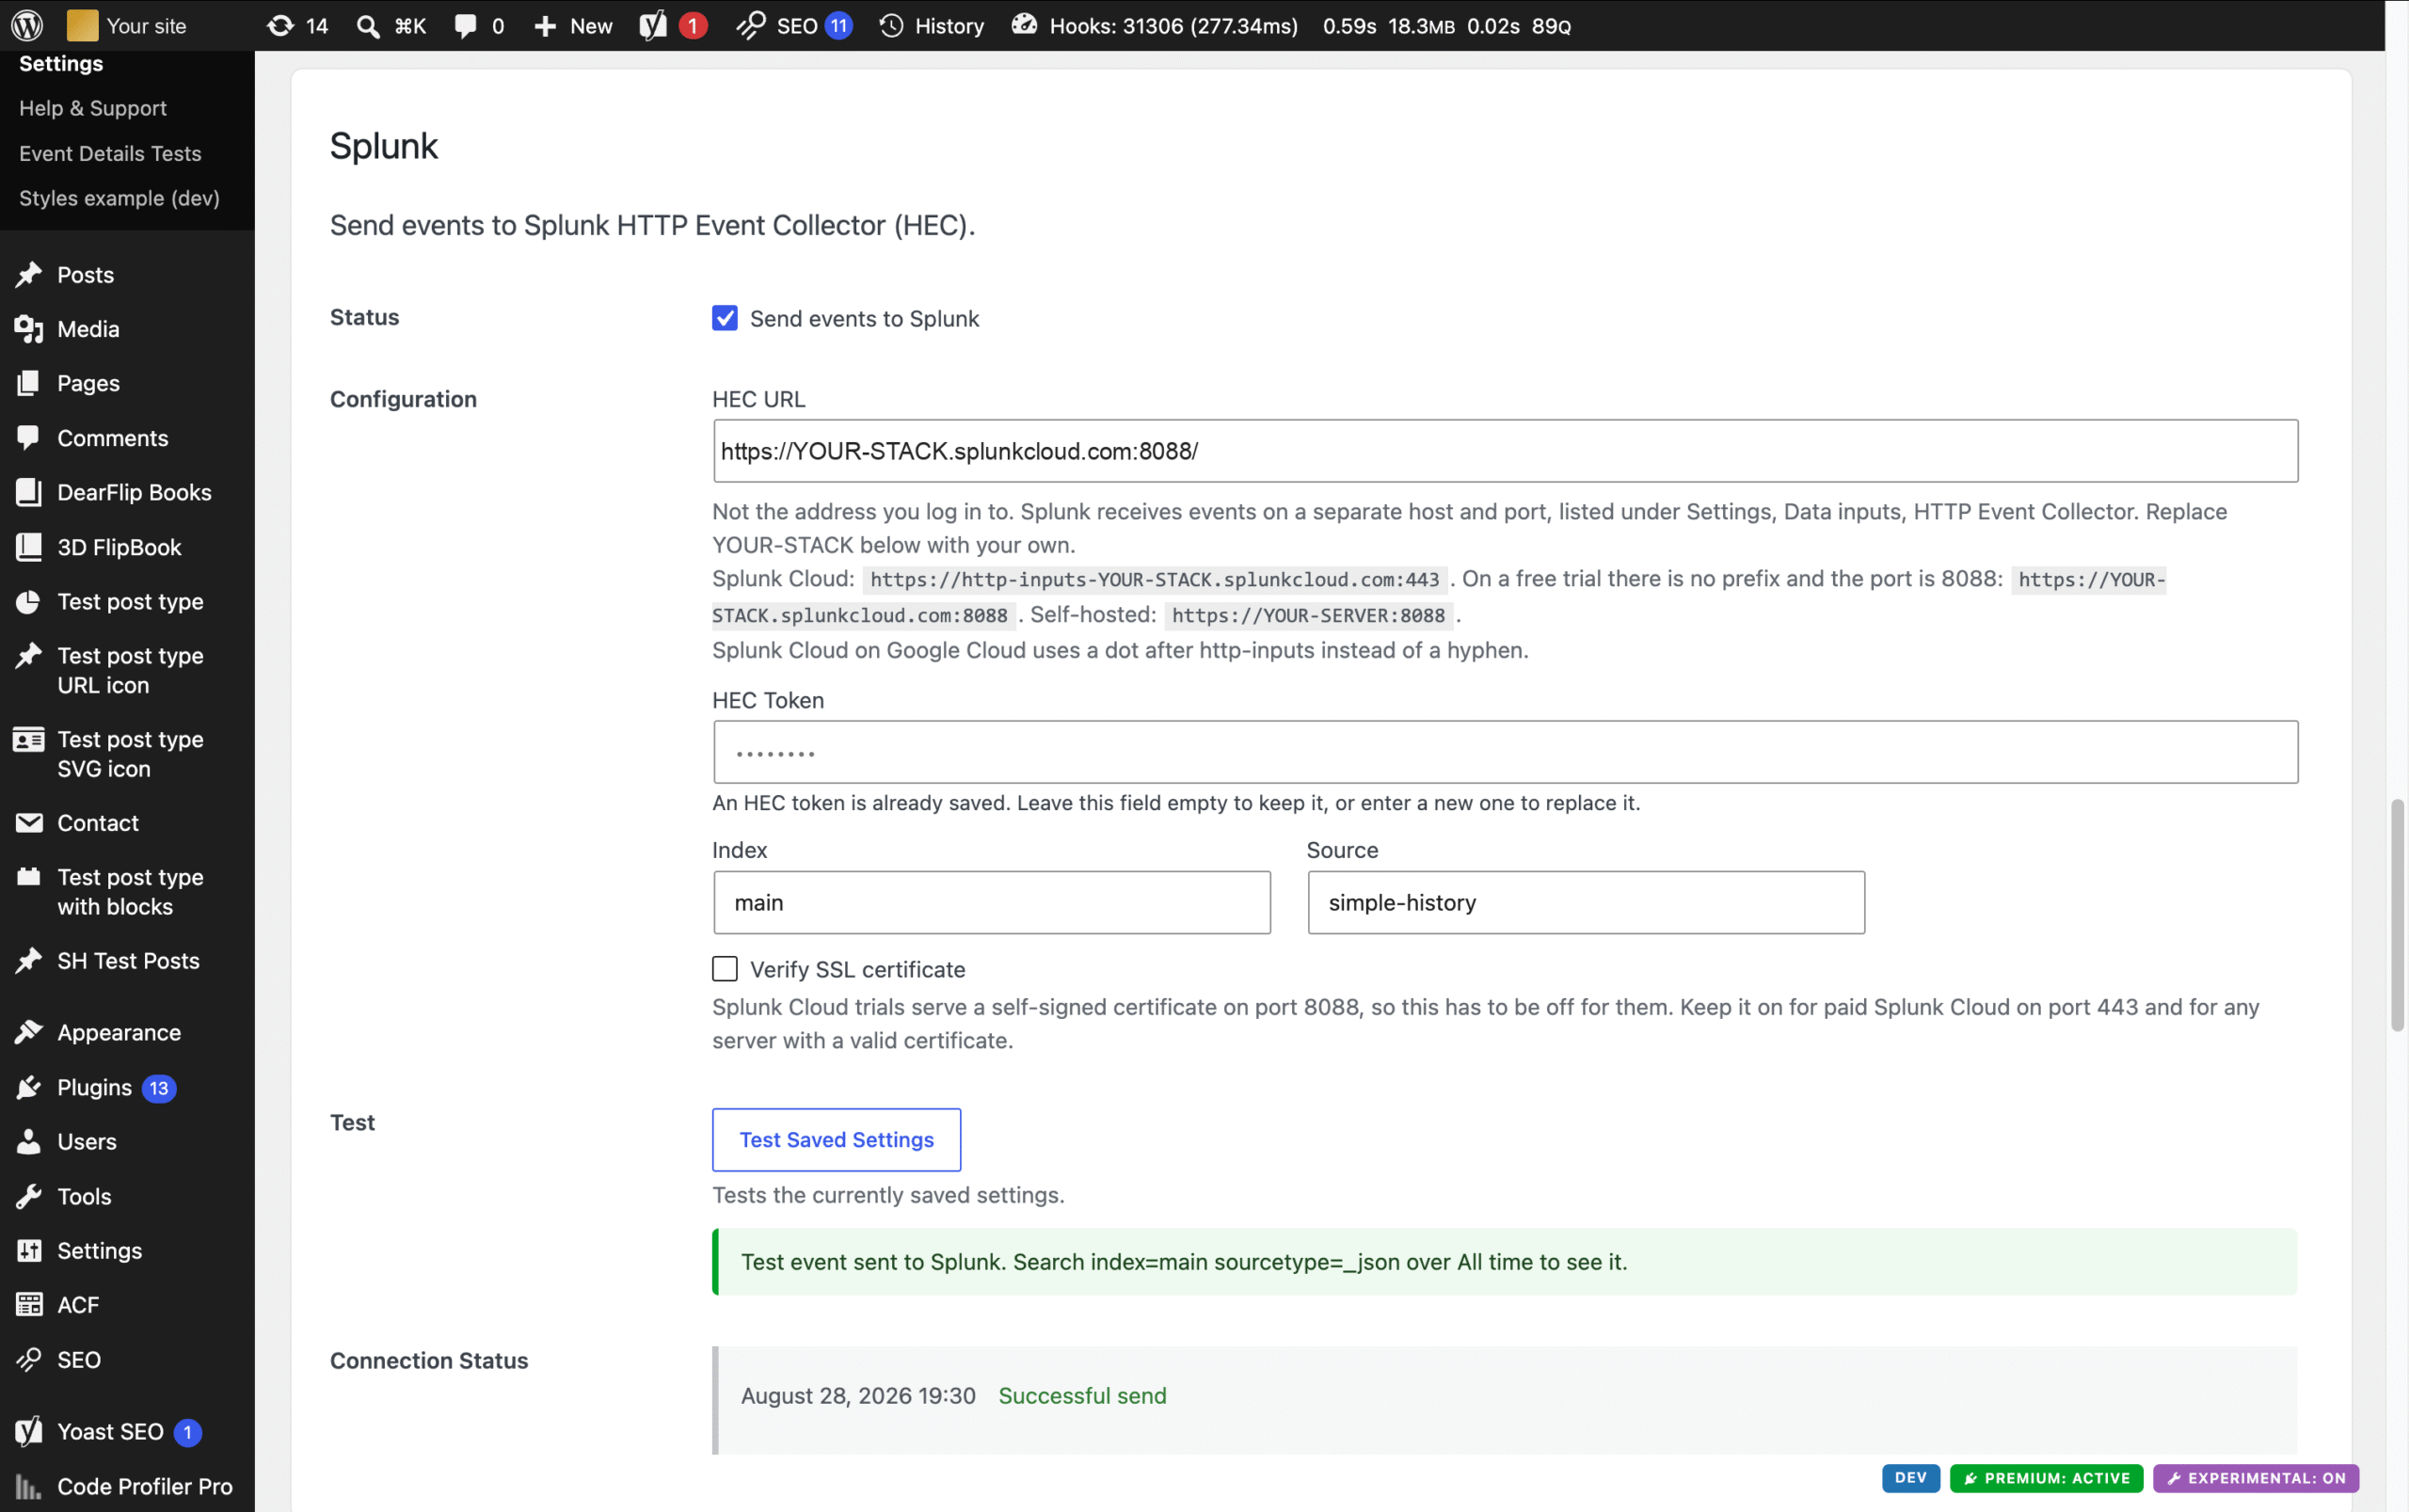
In WordPress, go to Simple History → Settings → Log Forwarding and scroll down to the Splunk section. Paste the HEC URL and the token, set the index and source, then save.
- Index must be one of the indexes the token is allowed to write to.
- Source is a label you choose. It becomes the
sourcefield in Splunk and is handy for telling several sites apart. - Verify SSL certificate should stay on for paid Splunk Cloud and for any server with a valid certificate. Splunk Cloud free trials serve a self-signed certificate on port 8088, so it has to be off for them.
Save the settings before testing. The test button checks what is saved, not what is currently typed in the form, and it tells you so.
Check that the events actually arrive
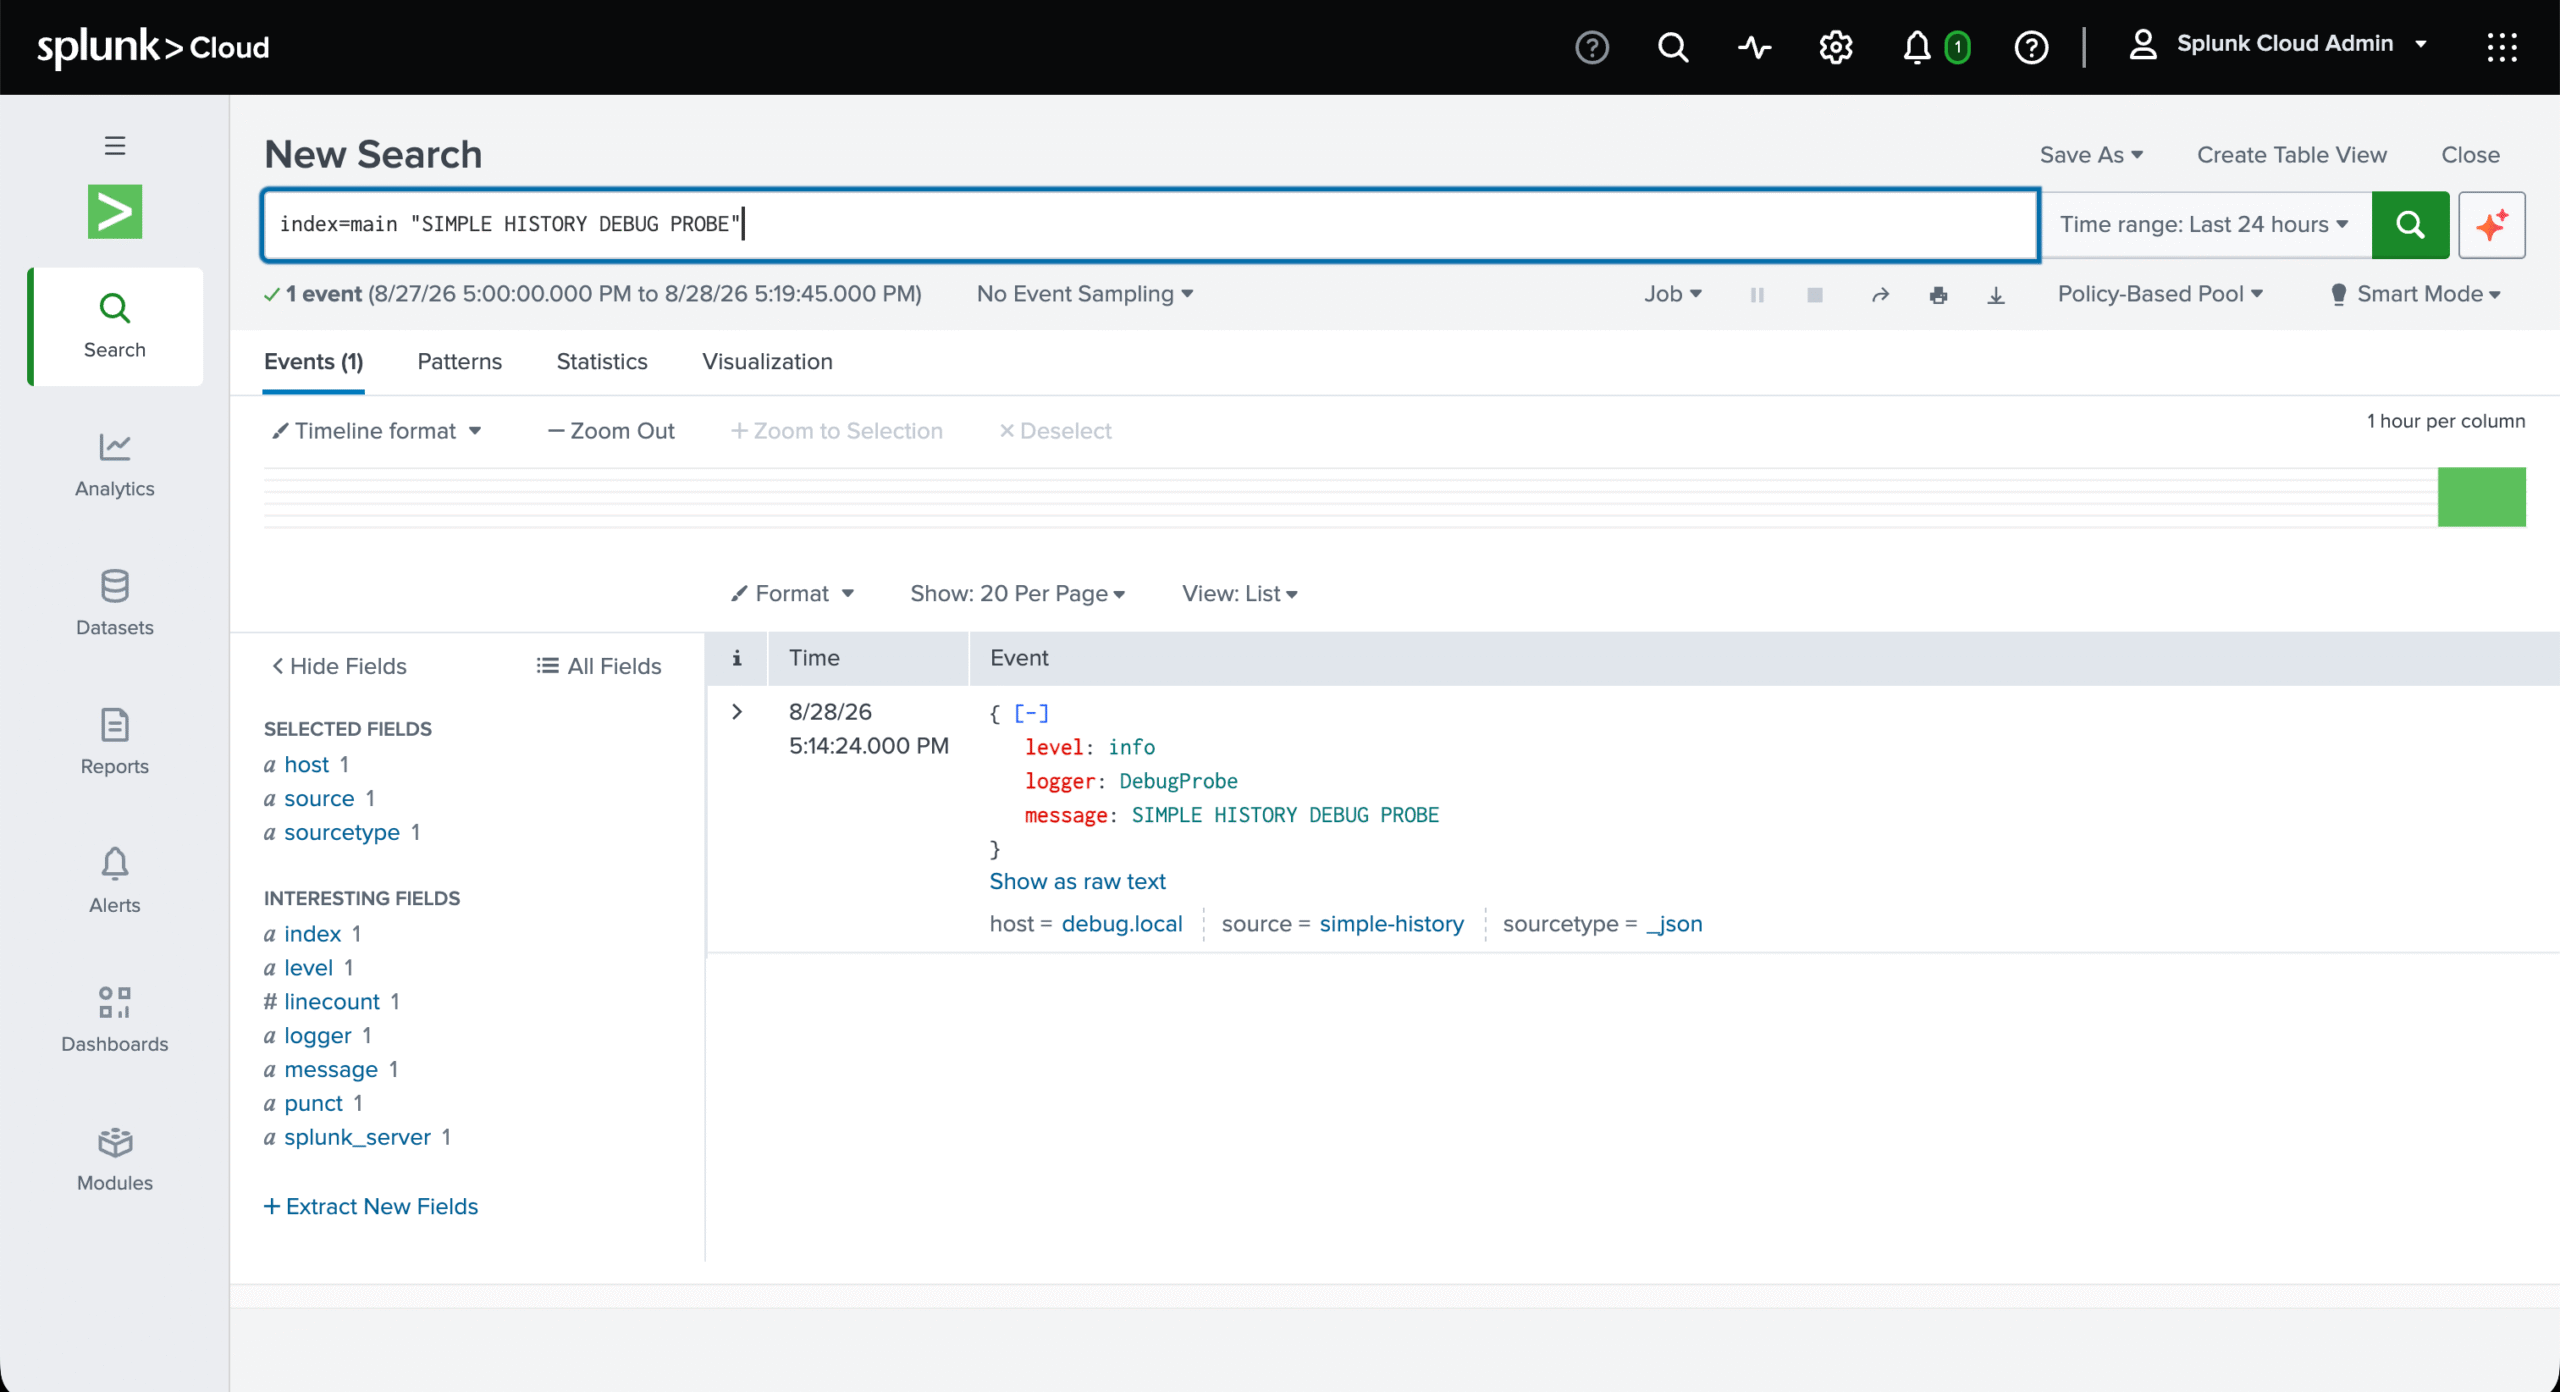
A successful test means Splunk accepted the event. Finding it is a separate step, and this is where setups tend to stall — a search that returns nothing looks exactly like data that never arrived.
Search for this in Splunk, replacing the index if you changed it, and set the time range to All time:
index=main sourcetype=_json- An empty search box returns nothing. Splunk always needs an index and a time range.
- The time picker defaults to a recent window, so older events are hidden rather than missing.
- Search results are a snapshot. Reloading the page in your browser does not re-run the search — press the search button again.
- Splunk shows times in the timezone of your Splunk profile, which may not match the times shown in WordPress.
What Simple History sends
Each event is a JSON object with the message, log level, the logger that produced it, and the user behind it. Splunk parses the fields automatically because the events are sent with sourcetype set to _json, following the HEC event format.
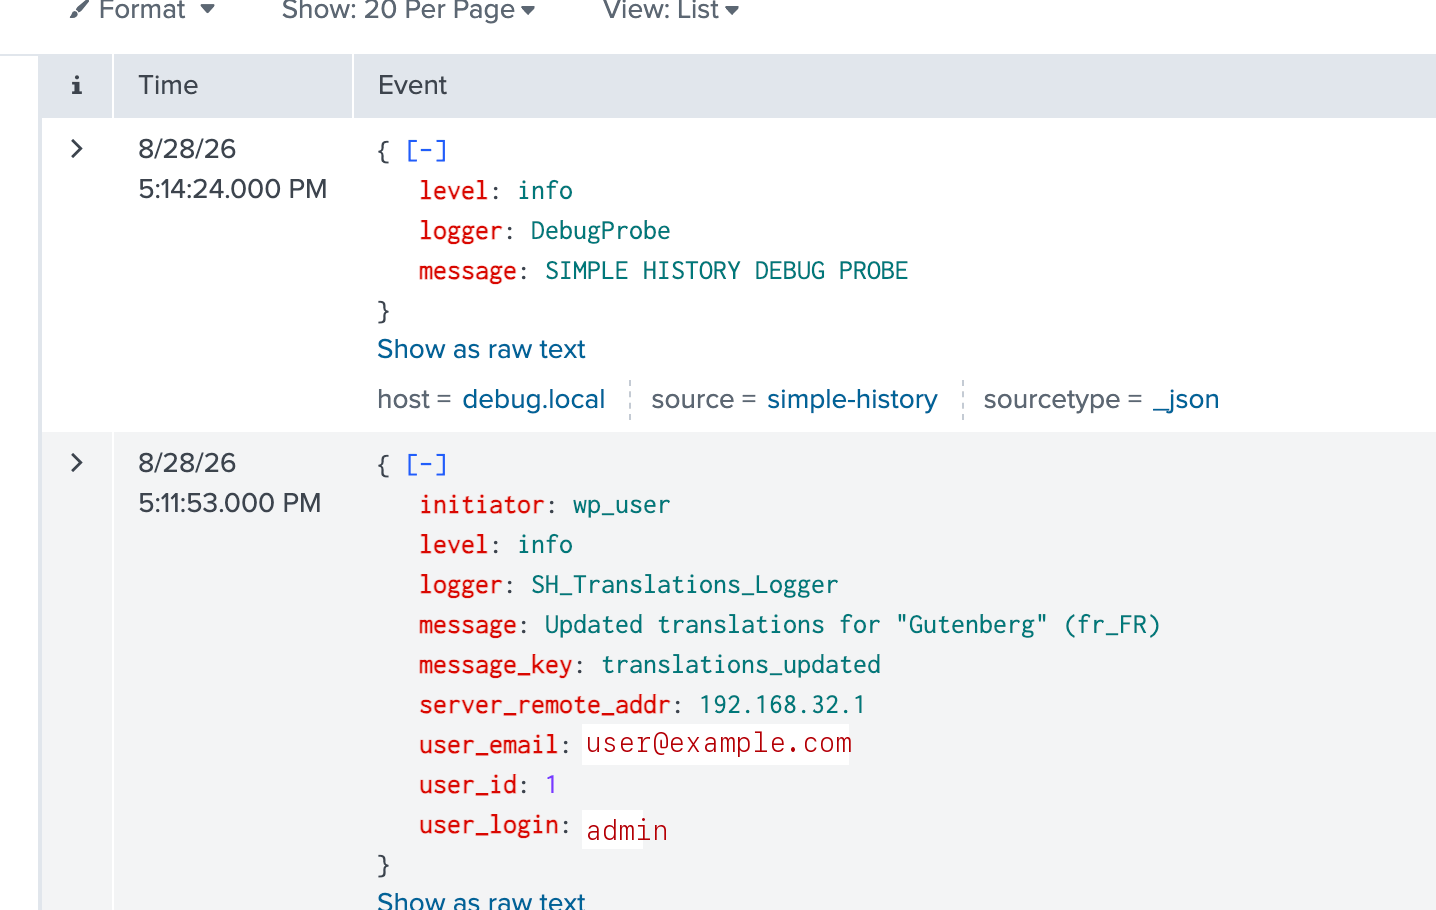
You can add your own fields to the payload with the simple_history/channel/splunk/payload filter.
Common errors
| What you see | What it means | What to do |
|---|---|---|
HTTP 413: Unexpected request data received | The URL points at the Splunk web interface, not at HEC. | Use the HEC host and port from the table above. |
Invalid token, code 4 | Splunk does not recognise the token on this stack. | Copy the token again from this stack. A token from an older or deleted stack will not work. |
code 1 | The token exists but is disabled. | Enable the token, and check that All Tokens is enabled in Global Settings. |
code 7 | The token is not allowed to write to that index. | Add the index under Select Allowed Indexes on the token. |
cURL error 60, SplunkServerDefaultCert | The endpoint serves a self-signed certificate, which is normal for free trials on port 8088. | Turn off Verify SSL certificate for that stack. |
cURL error 6: Could not resolve host | The host name does not exist. | Check the stack name and the prefix. Trials have no prefix; paid Splunk Cloud uses http-inputs. |
| Test succeeds but you cannot find the event | The event is indexed, the search is not matching. | Search index=main sourcetype=_json over All time, and press the search button rather than reloading. |
Questions
https://YOUR-STACK.splunkcloud.com:8088. Free trials have no http-inputs prefix and use port 8088 rather than 443.
Almost always the search rather than the data. Splunk needs both an index and a time range, and a completed search does not refresh when you reload the browser. Search index=main sourcetype=_json over All time and press the search button.
Only for Splunk Cloud free trials, which serve Splunk’s default self-signed certificate on port 8088. Paid Splunk Cloud and any server with a valid certificate should keep verification on.
Not directly. The free plugin can write a local log file, but only in human-readable text. The JSON Lines format that Splunk ingests cleanly, and sending events to HEC, are both part of Simple History Premium.
Log forwarding in Simple History Premium
Log forwarding to Splunk, Datadog, webhooks, syslog and remote databases is included in Simple History Premium, along with alerts, longer retention and full event export.